Immigrants from Burma/Myanmar vs White/Caucasian Householder Income Over 65 years
COMPARE
Immigrants from Burma/Myanmar
White/Caucasian
Householder Income Over 65 years
Householder Income Over 65 years Comparison
Immigrants from Burma/Myanmar
Whites/Caucasians
$57,114
HOUSEHOLDER INCOME OVER 65 YEARS
1.7/ 100
METRIC RATING
234th/ 347
METRIC RANK
$58,847
HOUSEHOLDER INCOME OVER 65 YEARS
9.8/ 100
METRIC RATING
213th/ 347
METRIC RANK
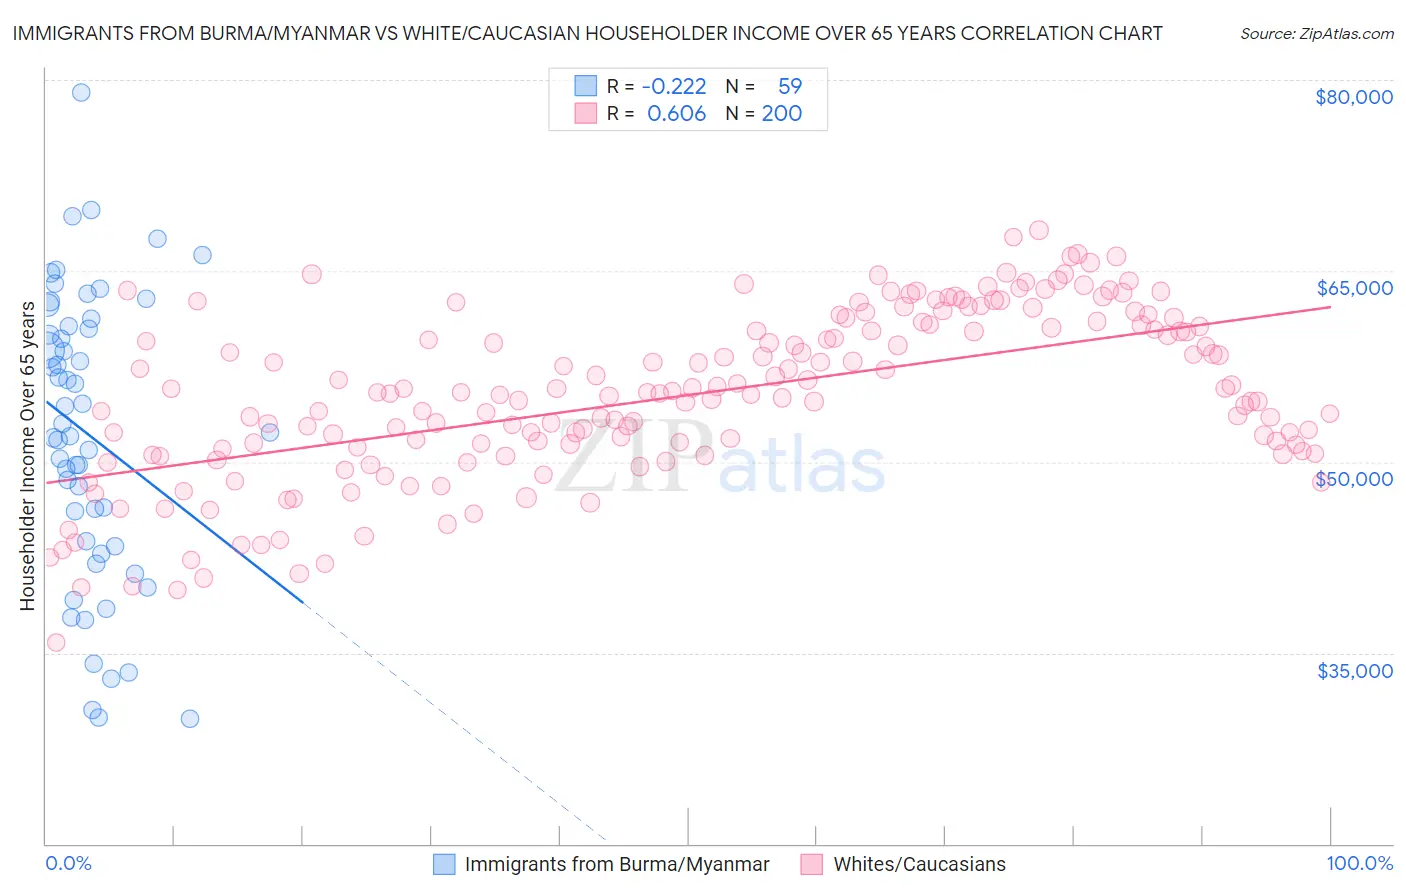
Immigrants from Burma/Myanmar vs White/Caucasian Householder Income Over 65 years Correlation Chart
The statistical analysis conducted on geographies consisting of 172,033,501 people shows a weak negative correlation between the proportion of Immigrants from Burma/Myanmar and household income with householder over the age of 65 in the United States with a correlation coefficient (R) of -0.222 and weighted average of $57,114. Similarly, the statistical analysis conducted on geographies consisting of 577,509,844 people shows a significant positive correlation between the proportion of Whites/Caucasians and household income with householder over the age of 65 in the United States with a correlation coefficient (R) of 0.606 and weighted average of $58,847, a difference of 3.0%.
Householder Income Over 65 years Correlation Summary
| Measurement | Immigrants from Burma/Myanmar | White/Caucasian |
| Minimum | $29,861 | $35,837 |
| Maximum | $78,969 | $68,217 |
| Range | $49,108 | $32,380 |
| Mean | $52,112 | $55,258 |
| Median | $52,321 | $55,418 |
| Interquartile 25% (IQ1) | $43,364 | $51,091 |
| Interquartile 75% (IQ3) | $60,699 | $60,670 |
| Interquartile Range (IQR) | $17,335 | $9,580 |
| Standard Deviation (Sample) | $11,315 | $6,600 |
| Standard Deviation (Population) | $11,219 | $6,583 |
Similar Demographics by Householder Income Over 65 years
Demographics Similar to Immigrants from Burma/Myanmar by Householder Income Over 65 years
In terms of householder income over 65 years, the demographic groups most similar to Immigrants from Burma/Myanmar are Immigrants from Western Africa ($57,119, a difference of 0.010%), Spanish American ($57,021, a difference of 0.16%), Immigrants from Uruguay ($56,975, a difference of 0.24%), Immigrants from Panama ($56,944, a difference of 0.30%), and Immigrants from Venezuela ($57,371, a difference of 0.45%).
| Demographics | Rating | Rank | Householder Income Over 65 years |
| Japanese | 3.9 /100 | #227 | Tragic $57,919 |
| Immigrants | Albania | 3.6 /100 | #228 | Tragic $57,828 |
| Immigrants | Colombia | 3.0 /100 | #229 | Tragic $57,658 |
| Immigrants | Cambodia | 2.8 /100 | #230 | Tragic $57,580 |
| Immigrants | Nonimmigrants | 2.4 /100 | #231 | Tragic $57,426 |
| Immigrants | Venezuela | 2.3 /100 | #232 | Tragic $57,371 |
| Immigrants | Western Africa | 1.7 /100 | #233 | Tragic $57,119 |
| Immigrants | Burma/Myanmar | 1.7 /100 | #234 | Tragic $57,114 |
| Spanish Americans | 1.6 /100 | #235 | Tragic $57,021 |
| Immigrants | Uruguay | 1.5 /100 | #236 | Tragic $56,975 |
| Immigrants | Panama | 1.5 /100 | #237 | Tragic $56,944 |
| Fijians | 1.2 /100 | #238 | Tragic $56,768 |
| Immigrants | Laos | 1.2 /100 | #239 | Tragic $56,722 |
| Sub-Saharan Africans | 1.0 /100 | #240 | Tragic $56,615 |
| Immigrants | Guyana | 0.9 /100 | #241 | Tragic $56,495 |
Demographics Similar to Whites/Caucasians by Householder Income Over 65 years
In terms of householder income over 65 years, the demographic groups most similar to Whites/Caucasians are Colombian ($58,851, a difference of 0.010%), Nepalese ($58,761, a difference of 0.15%), Immigrants from Nigeria ($58,942, a difference of 0.16%), Nigerian ($58,992, a difference of 0.25%), and Slovak ($59,039, a difference of 0.33%).
| Demographics | Rating | Rank | Householder Income Over 65 years |
| Immigrants | South America | 13.0 /100 | #206 | Poor $59,151 |
| Salvadorans | 12.9 /100 | #207 | Poor $59,141 |
| Uruguayans | 12.3 /100 | #208 | Poor $59,090 |
| Slovaks | 11.7 /100 | #209 | Poor $59,039 |
| Nigerians | 11.2 /100 | #210 | Poor $58,992 |
| Immigrants | Nigeria | 10.7 /100 | #211 | Poor $58,942 |
| Colombians | 9.8 /100 | #212 | Tragic $58,851 |
| Whites/Caucasians | 9.8 /100 | #213 | Tragic $58,847 |
| Nepalese | 9.0 /100 | #214 | Tragic $58,761 |
| Immigrants | Ghana | 7.9 /100 | #215 | Tragic $58,624 |
| Immigrants | Middle Africa | 6.2 /100 | #216 | Tragic $58,375 |
| Sudanese | 5.7 /100 | #217 | Tragic $58,281 |
| Panamanians | 5.6 /100 | #218 | Tragic $58,266 |
| Malaysians | 5.5 /100 | #219 | Tragic $58,244 |
| Yugoslavians | 5.5 /100 | #220 | Tragic $58,243 |