Immigrants from Burma/Myanmar vs Pueblo Householder Income Ages 25 - 44 years
COMPARE
Immigrants from Burma/Myanmar
Pueblo
Householder Income Ages 25 - 44 years
Householder Income Ages 25 - 44 years Comparison
Immigrants from Burma/Myanmar
Pueblo
$86,736
HOUSEHOLDER INCOME AGES 25 - 44 YEARS
1.3/ 100
METRIC RATING
246th/ 347
METRIC RANK
$68,910
HOUSEHOLDER INCOME AGES 25 - 44 YEARS
0.0/ 100
METRIC RATING
344th/ 347
METRIC RANK
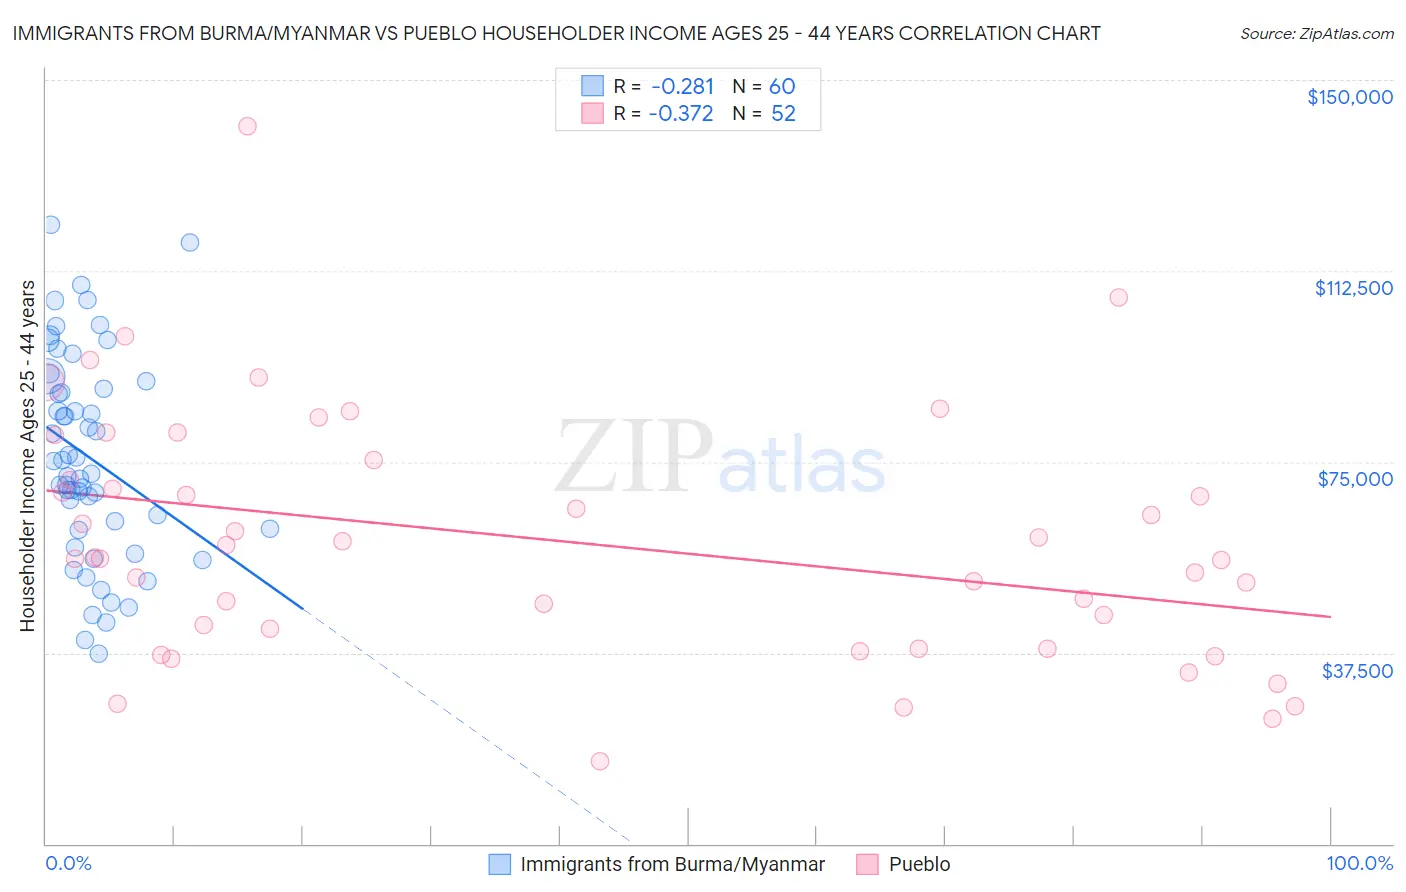
Immigrants from Burma/Myanmar vs Pueblo Householder Income Ages 25 - 44 years Correlation Chart
The statistical analysis conducted on geographies consisting of 172,191,155 people shows a weak negative correlation between the proportion of Immigrants from Burma/Myanmar and household income with householder between the ages 25 and 44 in the United States with a correlation coefficient (R) of -0.281 and weighted average of $86,736. Similarly, the statistical analysis conducted on geographies consisting of 119,922,511 people shows a mild negative correlation between the proportion of Pueblo and household income with householder between the ages 25 and 44 in the United States with a correlation coefficient (R) of -0.372 and weighted average of $68,910, a difference of 25.9%.
Householder Income Ages 25 - 44 years Correlation Summary
| Measurement | Immigrants from Burma/Myanmar | Pueblo |
| Minimum | $37,365 | $16,125 |
| Maximum | $121,540 | $140,852 |
| Range | $84,175 | $124,727 |
| Mean | $75,885 | $59,480 |
| Median | $73,968 | $56,103 |
| Interquartile 25% (IQ1) | $61,794 | $40,297 |
| Interquartile 75% (IQ3) | $90,078 | $73,434 |
| Interquartile Range (IQR) | $28,284 | $33,137 |
| Standard Deviation (Sample) | $20,099 | $24,239 |
| Standard Deviation (Population) | $19,931 | $24,005 |
Similar Demographics by Householder Income Ages 25 - 44 years
Demographics Similar to Immigrants from Burma/Myanmar by Householder Income Ages 25 - 44 years
In terms of householder income ages 25 - 44 years, the demographic groups most similar to Immigrants from Burma/Myanmar are Immigrants from Nigeria ($86,589, a difference of 0.17%), Immigrants from El Salvador ($86,913, a difference of 0.20%), Immigrants from Venezuela ($87,038, a difference of 0.35%), Immigrants from West Indies ($87,063, a difference of 0.38%), and West Indian ($87,205, a difference of 0.54%).
| Demographics | Rating | Rank | Householder Income Ages 25 - 44 years |
| Immigrants | Ghana | 2.2 /100 | #239 | Tragic $87,760 |
| Nicaraguans | 2.2 /100 | #240 | Tragic $87,751 |
| Nigerians | 2.2 /100 | #241 | Tragic $87,730 |
| West Indians | 1.7 /100 | #242 | Tragic $87,205 |
| Immigrants | West Indies | 1.5 /100 | #243 | Tragic $87,063 |
| Immigrants | Venezuela | 1.5 /100 | #244 | Tragic $87,038 |
| Immigrants | El Salvador | 1.4 /100 | #245 | Tragic $86,913 |
| Immigrants | Burma/Myanmar | 1.3 /100 | #246 | Tragic $86,736 |
| Immigrants | Nigeria | 1.2 /100 | #247 | Tragic $86,589 |
| Immigrants | Sudan | 0.9 /100 | #248 | Tragic $86,109 |
| French American Indians | 0.8 /100 | #249 | Tragic $85,899 |
| Pennsylvania Germans | 0.8 /100 | #250 | Tragic $85,836 |
| Cape Verdeans | 0.8 /100 | #251 | Tragic $85,758 |
| Immigrants | Western Africa | 0.7 /100 | #252 | Tragic $85,676 |
| British West Indians | 0.7 /100 | #253 | Tragic $85,565 |
Demographics Similar to Pueblo by Householder Income Ages 25 - 44 years
In terms of householder income ages 25 - 44 years, the demographic groups most similar to Pueblo are Tohono O'odham ($69,068, a difference of 0.23%), Crow ($71,337, a difference of 3.5%), Navajo ($66,529, a difference of 3.6%), Arapaho ($71,697, a difference of 4.0%), and Puerto Rican ($65,996, a difference of 4.4%).
| Demographics | Rating | Rank | Householder Income Ages 25 - 44 years |
| Hopi | 0.0 /100 | #333 | Tragic $75,002 |
| Creek | 0.0 /100 | #334 | Tragic $74,847 |
| Kiowa | 0.0 /100 | #335 | Tragic $74,776 |
| Yup'ik | 0.0 /100 | #336 | Tragic $73,688 |
| Blacks/African Americans | 0.0 /100 | #337 | Tragic $73,370 |
| Immigrants | Yemen | 0.0 /100 | #338 | Tragic $73,043 |
| Yuman | 0.0 /100 | #339 | Tragic $72,956 |
| Immigrants | Congo | 0.0 /100 | #340 | Tragic $72,178 |
| Arapaho | 0.0 /100 | #341 | Tragic $71,697 |
| Crow | 0.0 /100 | #342 | Tragic $71,337 |
| Tohono O'odham | 0.0 /100 | #343 | Tragic $69,068 |
| Pueblo | 0.0 /100 | #344 | Tragic $68,910 |
| Navajo | 0.0 /100 | #345 | Tragic $66,529 |
| Puerto Ricans | 0.0 /100 | #346 | Tragic $65,996 |
| Lumbee | 0.0 /100 | #347 | Tragic $60,305 |