African vs Iranian Receiving Food Stamps
COMPARE
African
Iranian
Receiving Food Stamps
Receiving Food Stamps Comparison
Africans
Iranians
15.1%
RECEIVING FOOD STAMPS
0.0/ 100
METRIC RATING
286th/ 347
METRIC RANK
7.9%
RECEIVING FOOD STAMPS
100.0/ 100
METRIC RATING
4th/ 347
METRIC RANK
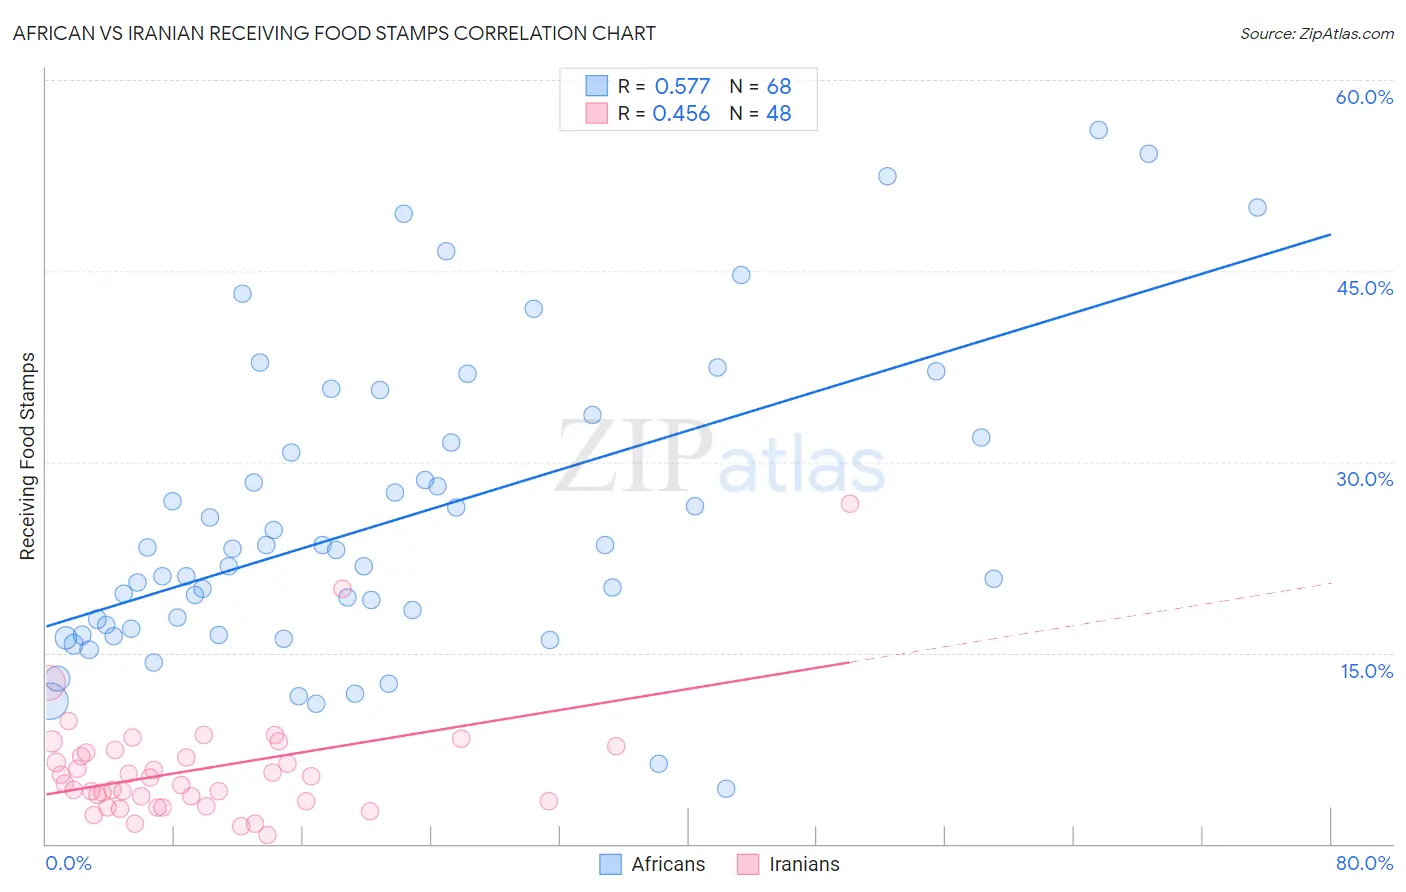
African vs Iranian Receiving Food Stamps Correlation Chart
The statistical analysis conducted on geographies consisting of 468,859,101 people shows a substantial positive correlation between the proportion of Africans and percentage of population receiving government assistance and/or food stamps in the United States with a correlation coefficient (R) of 0.577 and weighted average of 15.1%. Similarly, the statistical analysis conducted on geographies consisting of 315,912,646 people shows a moderate positive correlation between the proportion of Iranians and percentage of population receiving government assistance and/or food stamps in the United States with a correlation coefficient (R) of 0.456 and weighted average of 7.9%, a difference of 90.6%.
Receiving Food Stamps Correlation Summary
| Measurement | African | Iranian |
| Minimum | 4.3% | 0.70% |
| Maximum | 56.1% | 26.7% |
| Range | 51.8% | 26.0% |
| Mean | 25.4% | 5.9% |
| Median | 22.5% | 5.0% |
| Interquartile 25% (IQ1) | 16.6% | 3.3% |
| Interquartile 75% (IQ3) | 31.7% | 7.3% |
| Interquartile Range (IQR) | 15.1% | 4.0% |
| Standard Deviation (Sample) | 11.9% | 4.5% |
| Standard Deviation (Population) | 11.8% | 4.4% |
Similar Demographics by Receiving Food Stamps
Demographics Similar to Africans by Receiving Food Stamps
In terms of receiving food stamps, the demographic groups most similar to Africans are Immigrants from Liberia (15.1%, a difference of 0.14%), Immigrants from Mexico (15.2%, a difference of 0.23%), Immigrants from Ecuador (15.0%, a difference of 0.52%), Bangladeshi (15.0%, a difference of 0.53%), and Immigrants from Belize (15.2%, a difference of 0.69%).
| Demographics | Rating | Rank | Receiving Food Stamps |
| Kiowa | 0.0 /100 | #279 | Tragic 14.9% |
| Ecuadorians | 0.0 /100 | #280 | Tragic 14.9% |
| Spanish American Indians | 0.0 /100 | #281 | Tragic 14.9% |
| Immigrants | Central America | 0.0 /100 | #282 | Tragic 15.0% |
| Bangladeshis | 0.0 /100 | #283 | Tragic 15.0% |
| Immigrants | Ecuador | 0.0 /100 | #284 | Tragic 15.0% |
| Immigrants | Liberia | 0.0 /100 | #285 | Tragic 15.1% |
| Africans | 0.0 /100 | #286 | Tragic 15.1% |
| Immigrants | Mexico | 0.0 /100 | #287 | Tragic 15.2% |
| Immigrants | Belize | 0.0 /100 | #288 | Tragic 15.2% |
| Immigrants | Senegal | 0.0 /100 | #289 | Tragic 15.3% |
| Senegalese | 0.0 /100 | #290 | Tragic 15.4% |
| Hondurans | 0.0 /100 | #291 | Tragic 15.5% |
| Alaska Natives | 0.0 /100 | #292 | Tragic 15.6% |
| Vietnamese | 0.0 /100 | #293 | Tragic 15.7% |
Demographics Similar to Iranians by Receiving Food Stamps
In terms of receiving food stamps, the demographic groups most similar to Iranians are Thai (8.1%, a difference of 2.3%), Immigrants from Singapore (8.3%, a difference of 4.6%), Immigrants from Iran (8.3%, a difference of 5.2%), Filipino (7.4%, a difference of 7.3%), and Immigrants from India (7.4%, a difference of 7.6%).
| Demographics | Rating | Rank | Receiving Food Stamps |
| Immigrants | Taiwan | 100.0 /100 | #1 | Exceptional 7.3% |
| Immigrants | India | 100.0 /100 | #2 | Exceptional 7.4% |
| Filipinos | 100.0 /100 | #3 | Exceptional 7.4% |
| Iranians | 100.0 /100 | #4 | Exceptional 7.9% |
| Thais | 100.0 /100 | #5 | Exceptional 8.1% |
| Immigrants | Singapore | 100.0 /100 | #6 | Exceptional 8.3% |
| Immigrants | Iran | 100.0 /100 | #7 | Exceptional 8.3% |
| Burmese | 99.9 /100 | #8 | Exceptional 8.6% |
| Immigrants | Korea | 99.9 /100 | #9 | Exceptional 8.7% |
| Immigrants | South Central Asia | 99.9 /100 | #10 | Exceptional 8.8% |
| Okinawans | 99.9 /100 | #11 | Exceptional 8.9% |
| Cypriots | 99.9 /100 | #12 | Exceptional 8.9% |
| Bulgarians | 99.9 /100 | #13 | Exceptional 8.9% |
| Maltese | 99.9 /100 | #14 | Exceptional 8.9% |
| Norwegians | 99.9 /100 | #15 | Exceptional 9.0% |