Immigrants from Burma/Myanmar vs Vietnamese Receiving Food Stamps
COMPARE
Immigrants from Burma/Myanmar
Vietnamese
Receiving Food Stamps
Receiving Food Stamps Comparison
Immigrants from Burma/Myanmar
Vietnamese
12.9%
RECEIVING FOOD STAMPS
6.0/ 100
METRIC RATING
217th/ 347
METRIC RANK
15.7%
RECEIVING FOOD STAMPS
0.0/ 100
METRIC RATING
293rd/ 347
METRIC RANK
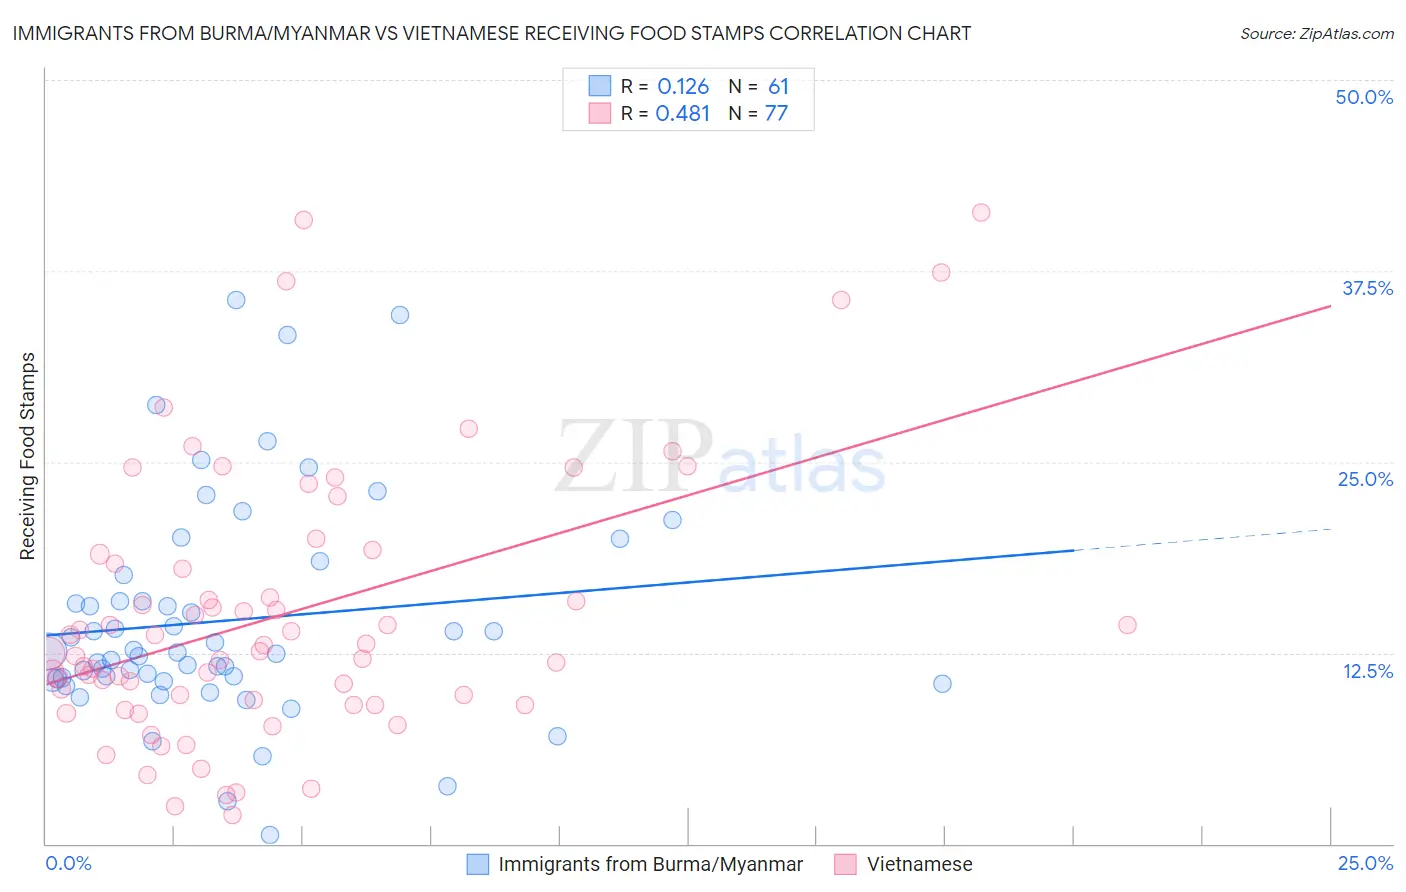
Immigrants from Burma/Myanmar vs Vietnamese Receiving Food Stamps Correlation Chart
The statistical analysis conducted on geographies consisting of 172,104,421 people shows a poor positive correlation between the proportion of Immigrants from Burma/Myanmar and percentage of population receiving government assistance and/or food stamps in the United States with a correlation coefficient (R) of 0.126 and weighted average of 12.9%. Similarly, the statistical analysis conducted on geographies consisting of 170,448,665 people shows a moderate positive correlation between the proportion of Vietnamese and percentage of population receiving government assistance and/or food stamps in the United States with a correlation coefficient (R) of 0.481 and weighted average of 15.7%, a difference of 21.7%.
Receiving Food Stamps Correlation Summary
| Measurement | Immigrants from Burma/Myanmar | Vietnamese |
| Minimum | 0.60% | 1.9% |
| Maximum | 35.6% | 41.3% |
| Range | 35.0% | 39.4% |
| Mean | 14.6% | 15.0% |
| Median | 12.5% | 12.6% |
| Interquartile 25% (IQ1) | 10.8% | 9.2% |
| Interquartile 75% (IQ3) | 16.7% | 18.6% |
| Interquartile Range (IQR) | 6.0% | 9.4% |
| Standard Deviation (Sample) | 7.2% | 8.8% |
| Standard Deviation (Population) | 7.1% | 8.8% |
Similar Demographics by Receiving Food Stamps
Demographics Similar to Immigrants from Burma/Myanmar by Receiving Food Stamps
In terms of receiving food stamps, the demographic groups most similar to Immigrants from Burma/Myanmar are Immigrants from South America (12.8%, a difference of 0.26%), Native Hawaiian (12.8%, a difference of 0.36%), Hawaiian (12.9%, a difference of 0.37%), Immigrants from Middle Africa (12.9%, a difference of 0.38%), and Immigrants from Colombia (12.9%, a difference of 0.41%).
| Demographics | Rating | Rank | Receiving Food Stamps |
| Immigrants | Uruguay | 12.8 /100 | #210 | Poor 12.5% |
| Colombians | 10.2 /100 | #211 | Poor 12.6% |
| Malaysians | 8.5 /100 | #212 | Tragic 12.7% |
| Moroccans | 7.6 /100 | #213 | Tragic 12.8% |
| Immigrants | Africa | 7.6 /100 | #214 | Tragic 12.8% |
| Native Hawaiians | 6.7 /100 | #215 | Tragic 12.8% |
| Immigrants | South America | 6.5 /100 | #216 | Tragic 12.8% |
| Immigrants | Burma/Myanmar | 6.0 /100 | #217 | Tragic 12.9% |
| Hawaiians | 5.4 /100 | #218 | Tragic 12.9% |
| Immigrants | Middle Africa | 5.4 /100 | #219 | Tragic 12.9% |
| Immigrants | Colombia | 5.3 /100 | #220 | Tragic 12.9% |
| Bermudans | 4.8 /100 | #221 | Tragic 13.0% |
| Immigrants | Immigrants | 4.4 /100 | #222 | Tragic 13.0% |
| Immigrants | Albania | 4.4 /100 | #223 | Tragic 13.0% |
| Immigrants | Armenia | 4.3 /100 | #224 | Tragic 13.0% |
Demographics Similar to Vietnamese by Receiving Food Stamps
In terms of receiving food stamps, the demographic groups most similar to Vietnamese are Immigrants from Latin America (15.7%, a difference of 0.11%), Alaska Native (15.6%, a difference of 0.30%), Immigrants from Honduras (15.7%, a difference of 0.43%), Tsimshian (15.7%, a difference of 0.44%), and Immigrants from Bahamas (15.8%, a difference of 0.60%).
| Demographics | Rating | Rank | Receiving Food Stamps |
| Africans | 0.0 /100 | #286 | Tragic 15.1% |
| Immigrants | Mexico | 0.0 /100 | #287 | Tragic 15.2% |
| Immigrants | Belize | 0.0 /100 | #288 | Tragic 15.2% |
| Immigrants | Senegal | 0.0 /100 | #289 | Tragic 15.3% |
| Senegalese | 0.0 /100 | #290 | Tragic 15.4% |
| Hondurans | 0.0 /100 | #291 | Tragic 15.5% |
| Alaska Natives | 0.0 /100 | #292 | Tragic 15.6% |
| Vietnamese | 0.0 /100 | #293 | Tragic 15.7% |
| Immigrants | Latin America | 0.0 /100 | #294 | Tragic 15.7% |
| Immigrants | Honduras | 0.0 /100 | #295 | Tragic 15.7% |
| Tsimshian | 0.0 /100 | #296 | Tragic 15.7% |
| Immigrants | Bahamas | 0.0 /100 | #297 | Tragic 15.8% |
| Immigrants | Trinidad and Tobago | 0.0 /100 | #298 | Tragic 15.8% |
| Hispanics or Latinos | 0.0 /100 | #299 | Tragic 15.8% |
| Immigrants | Bangladesh | 0.0 /100 | #300 | Tragic 15.9% |