Immigrants from Zaire vs Iranian Receiving Food Stamps
COMPARE
Immigrants from Zaire
Iranian
Receiving Food Stamps
Receiving Food Stamps Comparison
Immigrants from Zaire
Iranians
13.4%
RECEIVING FOOD STAMPS
1.9/ 100
METRIC RATING
235th/ 347
METRIC RANK
7.9%
RECEIVING FOOD STAMPS
100.0/ 100
METRIC RATING
4th/ 347
METRIC RANK
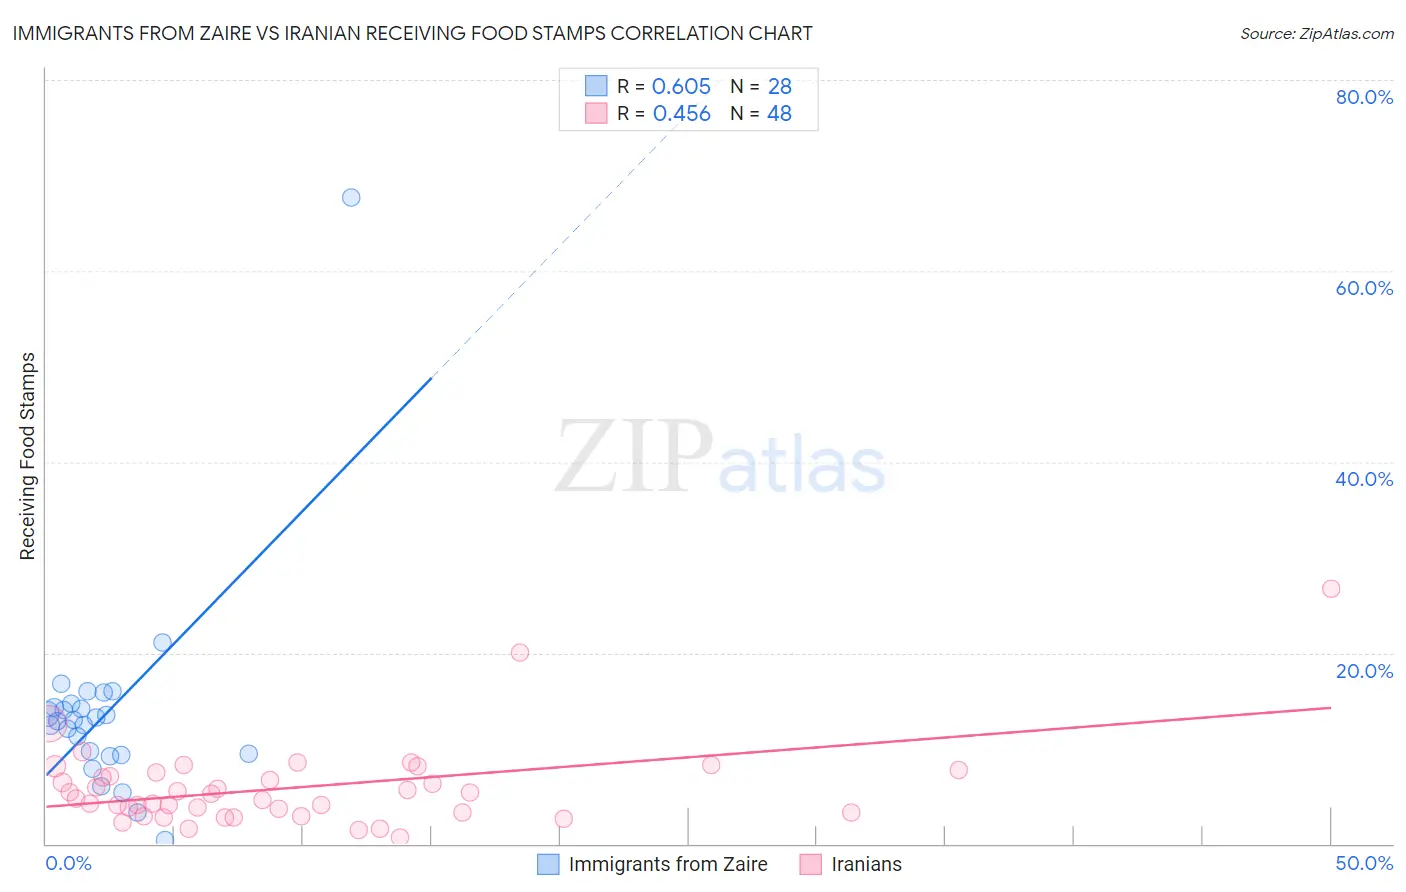
Immigrants from Zaire vs Iranian Receiving Food Stamps Correlation Chart
The statistical analysis conducted on geographies consisting of 107,223,376 people shows a significant positive correlation between the proportion of Immigrants from Zaire and percentage of population receiving government assistance and/or food stamps in the United States with a correlation coefficient (R) of 0.605 and weighted average of 13.4%. Similarly, the statistical analysis conducted on geographies consisting of 315,912,646 people shows a moderate positive correlation between the proportion of Iranians and percentage of population receiving government assistance and/or food stamps in the United States with a correlation coefficient (R) of 0.456 and weighted average of 7.9%, a difference of 68.4%.
Receiving Food Stamps Correlation Summary
| Measurement | Immigrants from Zaire | Iranian |
| Minimum | 0.40% | 0.70% |
| Maximum | 67.7% | 26.7% |
| Range | 67.3% | 26.0% |
| Mean | 13.7% | 5.9% |
| Median | 12.9% | 5.0% |
| Interquartile 25% (IQ1) | 9.3% | 3.3% |
| Interquartile 75% (IQ3) | 14.5% | 7.3% |
| Interquartile Range (IQR) | 5.1% | 4.0% |
| Standard Deviation (Sample) | 11.4% | 4.5% |
| Standard Deviation (Population) | 11.2% | 4.4% |
Similar Demographics by Receiving Food Stamps
Demographics Similar to Immigrants from Zaire by Receiving Food Stamps
In terms of receiving food stamps, the demographic groups most similar to Immigrants from Zaire are Crow (13.4%, a difference of 0.44%), Immigrants from El Salvador (13.5%, a difference of 0.67%), Comanche (13.3%, a difference of 0.77%), French American Indian (13.5%, a difference of 0.87%), and Cherokee (13.2%, a difference of 0.90%).
| Demographics | Rating | Rank | Receiving Food Stamps |
| Panamanians | 3.5 /100 | #228 | Tragic 13.1% |
| Ottawa | 3.5 /100 | #229 | Tragic 13.1% |
| Puget Sound Salish | 3.4 /100 | #230 | Tragic 13.1% |
| Immigrants | Nigeria | 3.4 /100 | #231 | Tragic 13.1% |
| Salvadorans | 2.7 /100 | #232 | Tragic 13.2% |
| Cherokee | 2.5 /100 | #233 | Tragic 13.2% |
| Comanche | 2.4 /100 | #234 | Tragic 13.3% |
| Immigrants | Zaire | 1.9 /100 | #235 | Tragic 13.4% |
| Crow | 1.6 /100 | #236 | Tragic 13.4% |
| Immigrants | El Salvador | 1.5 /100 | #237 | Tragic 13.5% |
| French American Indians | 1.4 /100 | #238 | Tragic 13.5% |
| Immigrants | Micronesia | 1.3 /100 | #239 | Tragic 13.5% |
| Iroquois | 1.2 /100 | #240 | Tragic 13.5% |
| Choctaw | 1.0 /100 | #241 | Tragic 13.6% |
| Immigrants | Panama | 1.0 /100 | #242 | Tragic 13.6% |
Demographics Similar to Iranians by Receiving Food Stamps
In terms of receiving food stamps, the demographic groups most similar to Iranians are Thai (8.1%, a difference of 2.3%), Immigrants from Singapore (8.3%, a difference of 4.6%), Immigrants from Iran (8.3%, a difference of 5.2%), Filipino (7.4%, a difference of 7.3%), and Immigrants from India (7.4%, a difference of 7.6%).
| Demographics | Rating | Rank | Receiving Food Stamps |
| Immigrants | Taiwan | 100.0 /100 | #1 | Exceptional 7.3% |
| Immigrants | India | 100.0 /100 | #2 | Exceptional 7.4% |
| Filipinos | 100.0 /100 | #3 | Exceptional 7.4% |
| Iranians | 100.0 /100 | #4 | Exceptional 7.9% |
| Thais | 100.0 /100 | #5 | Exceptional 8.1% |
| Immigrants | Singapore | 100.0 /100 | #6 | Exceptional 8.3% |
| Immigrants | Iran | 100.0 /100 | #7 | Exceptional 8.3% |
| Burmese | 99.9 /100 | #8 | Exceptional 8.6% |
| Immigrants | Korea | 99.9 /100 | #9 | Exceptional 8.7% |
| Immigrants | South Central Asia | 99.9 /100 | #10 | Exceptional 8.8% |
| Okinawans | 99.9 /100 | #11 | Exceptional 8.9% |
| Cypriots | 99.9 /100 | #12 | Exceptional 8.9% |
| Bulgarians | 99.9 /100 | #13 | Exceptional 8.9% |
| Maltese | 99.9 /100 | #14 | Exceptional 8.9% |
| Norwegians | 99.9 /100 | #15 | Exceptional 9.0% |