Immigrants from Netherlands vs Iranian Receiving Food Stamps
COMPARE
Immigrants from Netherlands
Iranian
Receiving Food Stamps
Receiving Food Stamps Comparison
Immigrants from Netherlands
Iranians
9.5%
RECEIVING FOOD STAMPS
99.5/ 100
METRIC RATING
40th/ 347
METRIC RANK
7.9%
RECEIVING FOOD STAMPS
100.0/ 100
METRIC RATING
4th/ 347
METRIC RANK
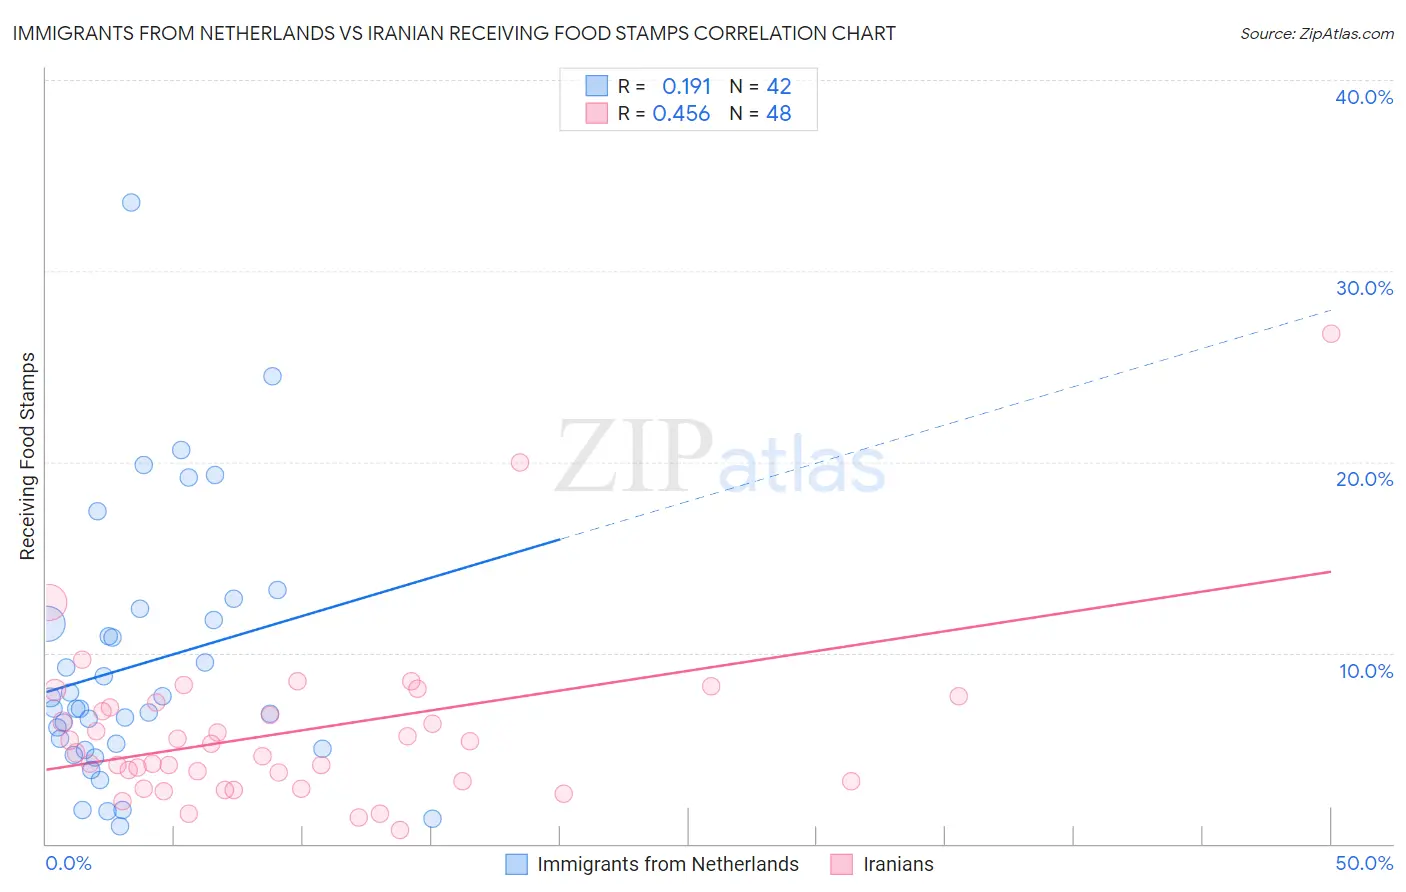
Immigrants from Netherlands vs Iranian Receiving Food Stamps Correlation Chart
The statistical analysis conducted on geographies consisting of 237,448,822 people shows a poor positive correlation between the proportion of Immigrants from Netherlands and percentage of population receiving government assistance and/or food stamps in the United States with a correlation coefficient (R) of 0.191 and weighted average of 9.5%. Similarly, the statistical analysis conducted on geographies consisting of 315,912,646 people shows a moderate positive correlation between the proportion of Iranians and percentage of population receiving government assistance and/or food stamps in the United States with a correlation coefficient (R) of 0.456 and weighted average of 7.9%, a difference of 20.0%.
Receiving Food Stamps Correlation Summary
| Measurement | Immigrants from Netherlands | Iranian |
| Minimum | 0.90% | 0.70% |
| Maximum | 33.6% | 26.7% |
| Range | 32.7% | 26.0% |
| Mean | 9.4% | 5.9% |
| Median | 7.1% | 5.0% |
| Interquartile 25% (IQ1) | 5.0% | 3.3% |
| Interquartile 75% (IQ3) | 11.7% | 7.3% |
| Interquartile Range (IQR) | 6.7% | 4.0% |
| Standard Deviation (Sample) | 6.9% | 4.5% |
| Standard Deviation (Population) | 6.8% | 4.4% |
Similar Demographics by Receiving Food Stamps
Demographics Similar to Immigrants from Netherlands by Receiving Food Stamps
In terms of receiving food stamps, the demographic groups most similar to Immigrants from Netherlands are Immigrants from Bolivia (9.5%, a difference of 0.010%), Immigrants from Sri Lanka (9.5%, a difference of 0.020%), Cambodian (9.5%, a difference of 0.17%), European (9.5%, a difference of 0.31%), and Estonian (9.5%, a difference of 0.37%).
| Demographics | Rating | Rank | Receiving Food Stamps |
| Zimbabweans | 99.6 /100 | #33 | Exceptional 9.5% |
| Turks | 99.6 /100 | #34 | Exceptional 9.5% |
| Immigrants | Austria | 99.6 /100 | #35 | Exceptional 9.5% |
| Estonians | 99.6 /100 | #36 | Exceptional 9.5% |
| Europeans | 99.6 /100 | #37 | Exceptional 9.5% |
| Immigrants | Sri Lanka | 99.5 /100 | #38 | Exceptional 9.5% |
| Immigrants | Bolivia | 99.5 /100 | #39 | Exceptional 9.5% |
| Immigrants | Netherlands | 99.5 /100 | #40 | Exceptional 9.5% |
| Cambodians | 99.5 /100 | #41 | Exceptional 9.5% |
| Immigrants | China | 99.5 /100 | #42 | Exceptional 9.6% |
| Croatians | 99.5 /100 | #43 | Exceptional 9.6% |
| Immigrants | Denmark | 99.4 /100 | #44 | Exceptional 9.6% |
| Immigrants | Belgium | 99.4 /100 | #45 | Exceptional 9.6% |
| Australians | 99.4 /100 | #46 | Exceptional 9.6% |
| Indians (Asian) | 99.4 /100 | #47 | Exceptional 9.6% |
Demographics Similar to Iranians by Receiving Food Stamps
In terms of receiving food stamps, the demographic groups most similar to Iranians are Thai (8.1%, a difference of 2.3%), Immigrants from Singapore (8.3%, a difference of 4.6%), Immigrants from Iran (8.3%, a difference of 5.2%), Filipino (7.4%, a difference of 7.3%), and Immigrants from India (7.4%, a difference of 7.6%).
| Demographics | Rating | Rank | Receiving Food Stamps |
| Immigrants | Taiwan | 100.0 /100 | #1 | Exceptional 7.3% |
| Immigrants | India | 100.0 /100 | #2 | Exceptional 7.4% |
| Filipinos | 100.0 /100 | #3 | Exceptional 7.4% |
| Iranians | 100.0 /100 | #4 | Exceptional 7.9% |
| Thais | 100.0 /100 | #5 | Exceptional 8.1% |
| Immigrants | Singapore | 100.0 /100 | #6 | Exceptional 8.3% |
| Immigrants | Iran | 100.0 /100 | #7 | Exceptional 8.3% |
| Burmese | 99.9 /100 | #8 | Exceptional 8.6% |
| Immigrants | Korea | 99.9 /100 | #9 | Exceptional 8.7% |
| Immigrants | South Central Asia | 99.9 /100 | #10 | Exceptional 8.8% |
| Okinawans | 99.9 /100 | #11 | Exceptional 8.9% |
| Cypriots | 99.9 /100 | #12 | Exceptional 8.9% |
| Bulgarians | 99.9 /100 | #13 | Exceptional 8.9% |
| Maltese | 99.9 /100 | #14 | Exceptional 8.9% |
| Norwegians | 99.9 /100 | #15 | Exceptional 9.0% |