Immigrants from Burma/Myanmar vs Asian Receiving Food Stamps
COMPARE
Immigrants from Burma/Myanmar
Asian
Receiving Food Stamps
Receiving Food Stamps Comparison
Immigrants from Burma/Myanmar
Asians
12.9%
RECEIVING FOOD STAMPS
6.0/ 100
METRIC RATING
217th/ 347
METRIC RANK
9.7%
RECEIVING FOOD STAMPS
99.3/ 100
METRIC RATING
51st/ 347
METRIC RANK
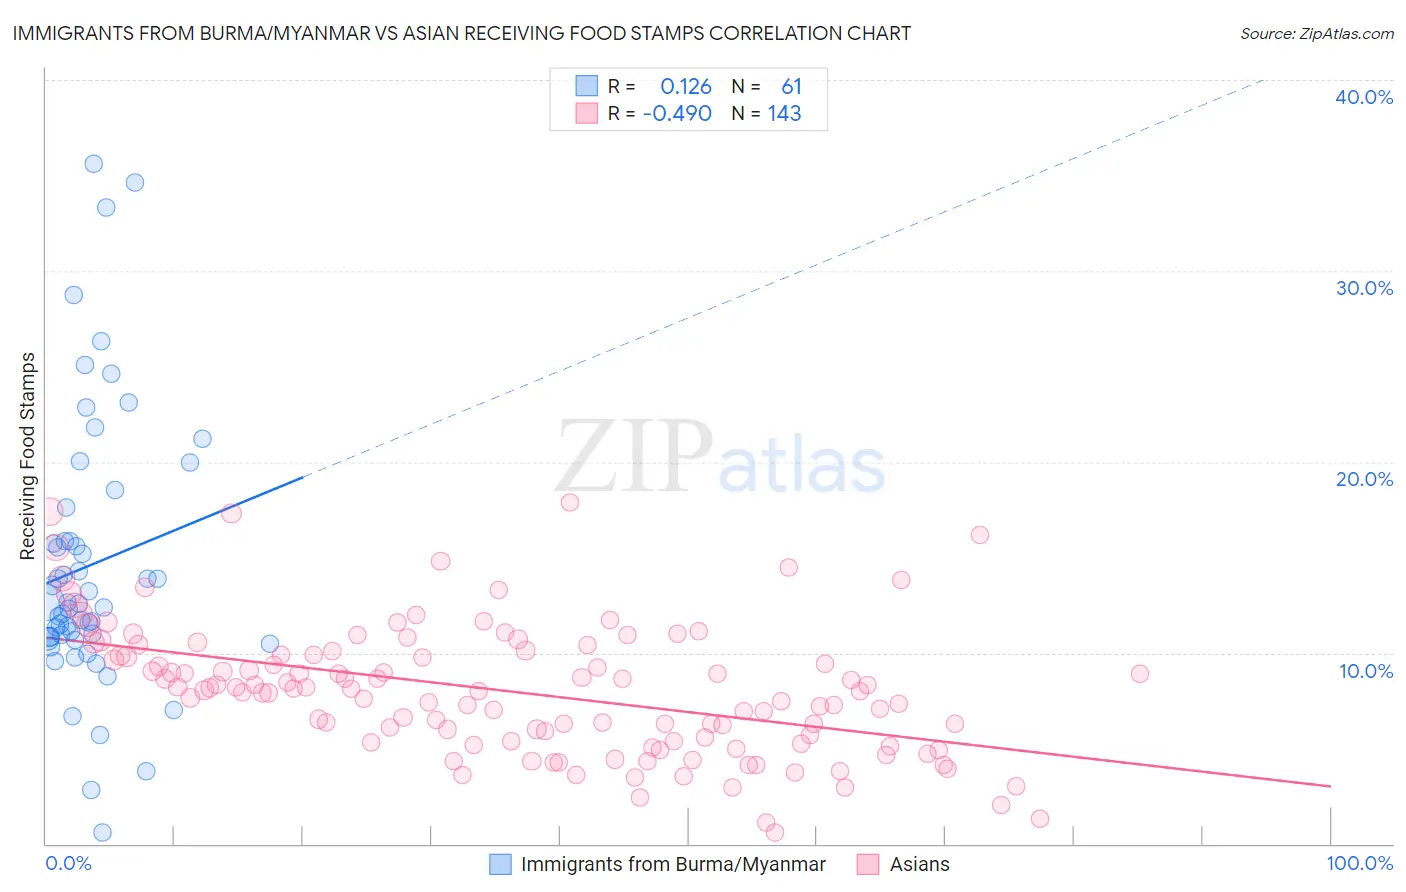
Immigrants from Burma/Myanmar vs Asian Receiving Food Stamps Correlation Chart
The statistical analysis conducted on geographies consisting of 172,104,421 people shows a poor positive correlation between the proportion of Immigrants from Burma/Myanmar and percentage of population receiving government assistance and/or food stamps in the United States with a correlation coefficient (R) of 0.126 and weighted average of 12.9%. Similarly, the statistical analysis conducted on geographies consisting of 547,774,062 people shows a moderate negative correlation between the proportion of Asians and percentage of population receiving government assistance and/or food stamps in the United States with a correlation coefficient (R) of -0.490 and weighted average of 9.7%, a difference of 32.9%.
Receiving Food Stamps Correlation Summary
| Measurement | Immigrants from Burma/Myanmar | Asian |
| Minimum | 0.60% | 0.60% |
| Maximum | 35.6% | 17.9% |
| Range | 35.0% | 17.3% |
| Mean | 14.6% | 8.0% |
| Median | 12.5% | 8.0% |
| Interquartile 25% (IQ1) | 10.8% | 5.3% |
| Interquartile 75% (IQ3) | 16.7% | 9.9% |
| Interquartile Range (IQR) | 6.0% | 4.6% |
| Standard Deviation (Sample) | 7.2% | 3.4% |
| Standard Deviation (Population) | 7.1% | 3.4% |
Similar Demographics by Receiving Food Stamps
Demographics Similar to Immigrants from Burma/Myanmar by Receiving Food Stamps
In terms of receiving food stamps, the demographic groups most similar to Immigrants from Burma/Myanmar are Immigrants from South America (12.8%, a difference of 0.26%), Native Hawaiian (12.8%, a difference of 0.36%), Hawaiian (12.9%, a difference of 0.37%), Immigrants from Middle Africa (12.9%, a difference of 0.38%), and Immigrants from Colombia (12.9%, a difference of 0.41%).
| Demographics | Rating | Rank | Receiving Food Stamps |
| Immigrants | Uruguay | 12.8 /100 | #210 | Poor 12.5% |
| Colombians | 10.2 /100 | #211 | Poor 12.6% |
| Malaysians | 8.5 /100 | #212 | Tragic 12.7% |
| Moroccans | 7.6 /100 | #213 | Tragic 12.8% |
| Immigrants | Africa | 7.6 /100 | #214 | Tragic 12.8% |
| Native Hawaiians | 6.7 /100 | #215 | Tragic 12.8% |
| Immigrants | South America | 6.5 /100 | #216 | Tragic 12.8% |
| Immigrants | Burma/Myanmar | 6.0 /100 | #217 | Tragic 12.9% |
| Hawaiians | 5.4 /100 | #218 | Tragic 12.9% |
| Immigrants | Middle Africa | 5.4 /100 | #219 | Tragic 12.9% |
| Immigrants | Colombia | 5.3 /100 | #220 | Tragic 12.9% |
| Bermudans | 4.8 /100 | #221 | Tragic 13.0% |
| Immigrants | Immigrants | 4.4 /100 | #222 | Tragic 13.0% |
| Immigrants | Albania | 4.4 /100 | #223 | Tragic 13.0% |
| Immigrants | Armenia | 4.3 /100 | #224 | Tragic 13.0% |
Demographics Similar to Asians by Receiving Food Stamps
In terms of receiving food stamps, the demographic groups most similar to Asians are Immigrants from South Africa (9.7%, a difference of 0.010%), Tongan (9.7%, a difference of 0.030%), Swiss (9.7%, a difference of 0.15%), Immigrants from Switzerland (9.7%, a difference of 0.16%), and Lithuanian (9.7%, a difference of 0.18%).
| Demographics | Rating | Rank | Receiving Food Stamps |
| Immigrants | Denmark | 99.4 /100 | #44 | Exceptional 9.6% |
| Immigrants | Belgium | 99.4 /100 | #45 | Exceptional 9.6% |
| Australians | 99.4 /100 | #46 | Exceptional 9.6% |
| Indians (Asian) | 99.4 /100 | #47 | Exceptional 9.6% |
| Russians | 99.4 /100 | #48 | Exceptional 9.6% |
| Immigrants | Czechoslovakia | 99.4 /100 | #49 | Exceptional 9.6% |
| Lithuanians | 99.4 /100 | #50 | Exceptional 9.7% |
| Asians | 99.3 /100 | #51 | Exceptional 9.7% |
| Immigrants | South Africa | 99.3 /100 | #52 | Exceptional 9.7% |
| Tongans | 99.3 /100 | #53 | Exceptional 9.7% |
| Swiss | 99.3 /100 | #54 | Exceptional 9.7% |
| Immigrants | Switzerland | 99.3 /100 | #55 | Exceptional 9.7% |
| Immigrants | Canada | 99.3 /100 | #56 | Exceptional 9.7% |
| Greeks | 99.3 /100 | #57 | Exceptional 9.7% |
| Scandinavians | 99.2 /100 | #58 | Exceptional 9.7% |