Immigrants from Burma/Myanmar vs Immigrants from Iran Single Father Poverty
COMPARE
Immigrants from Burma/Myanmar
Immigrants from Iran
Single Father Poverty
Single Father Poverty Comparison
Immigrants from Burma/Myanmar
Immigrants from Iran
16.5%
SINGLE FATHER POVERTY
28.0/ 100
METRIC RATING
190th/ 347
METRIC RANK
14.2%
SINGLE FATHER POVERTY
100.0/ 100
METRIC RATING
16th/ 347
METRIC RANK
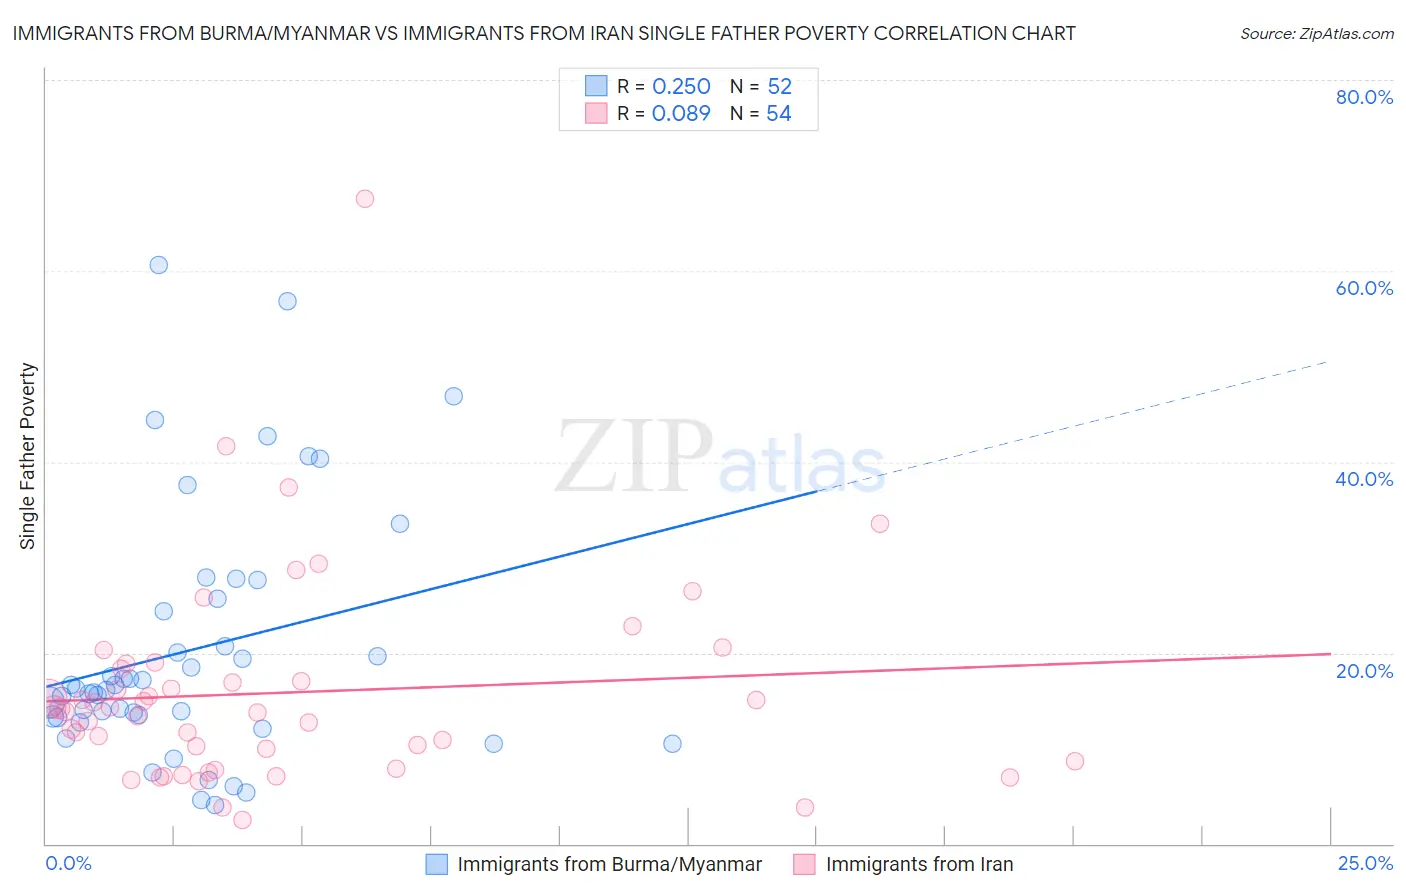
Immigrants from Burma/Myanmar vs Immigrants from Iran Single Father Poverty Correlation Chart
The statistical analysis conducted on geographies consisting of 151,197,682 people shows a weak positive correlation between the proportion of Immigrants from Burma/Myanmar and poverty level among single fathers in the United States with a correlation coefficient (R) of 0.250 and weighted average of 16.5%. Similarly, the statistical analysis conducted on geographies consisting of 227,784,696 people shows a slight positive correlation between the proportion of Immigrants from Iran and poverty level among single fathers in the United States with a correlation coefficient (R) of 0.089 and weighted average of 14.2%, a difference of 16.1%.
Single Father Poverty Correlation Summary
| Measurement | Immigrants from Burma/Myanmar | Immigrants from Iran |
| Minimum | 4.1% | 2.4% |
| Maximum | 60.6% | 67.6% |
| Range | 56.5% | 65.1% |
| Mean | 20.3% | 15.8% |
| Median | 16.1% | 14.0% |
| Interquartile 25% (IQ1) | 13.3% | 8.7% |
| Interquartile 75% (IQ3) | 25.0% | 18.3% |
| Interquartile Range (IQR) | 11.8% | 9.6% |
| Standard Deviation (Sample) | 13.0% | 10.9% |
| Standard Deviation (Population) | 12.9% | 10.8% |
Similar Demographics by Single Father Poverty
Demographics Similar to Immigrants from Burma/Myanmar by Single Father Poverty
In terms of single father poverty, the demographic groups most similar to Immigrants from Burma/Myanmar are Latvian (16.5%, a difference of 0.050%), Immigrants from Guyana (16.5%, a difference of 0.050%), Russian (16.4%, a difference of 0.11%), Ukrainian (16.4%, a difference of 0.12%), and Immigrants from Venezuela (16.4%, a difference of 0.16%).
| Demographics | Rating | Rank | Single Father Poverty |
| Aleuts | 35.3 /100 | #183 | Fair 16.4% |
| Cambodians | 34.6 /100 | #184 | Fair 16.4% |
| Panamanians | 33.6 /100 | #185 | Fair 16.4% |
| Immigrants | Venezuela | 31.0 /100 | #186 | Fair 16.4% |
| Ukrainians | 30.4 /100 | #187 | Fair 16.4% |
| Russians | 30.1 /100 | #188 | Fair 16.4% |
| Latvians | 28.9 /100 | #189 | Fair 16.5% |
| Immigrants | Burma/Myanmar | 28.0 /100 | #190 | Fair 16.5% |
| Immigrants | Guyana | 27.1 /100 | #191 | Fair 16.5% |
| Immigrants | Switzerland | 24.8 /100 | #192 | Fair 16.5% |
| Ecuadorians | 24.5 /100 | #193 | Fair 16.5% |
| Cape Verdeans | 24.4 /100 | #194 | Fair 16.5% |
| Immigrants | Barbados | 24.3 /100 | #195 | Fair 16.5% |
| Immigrants | Canada | 21.9 /100 | #196 | Fair 16.5% |
| Immigrants | Northern Europe | 20.3 /100 | #197 | Fair 16.5% |
Demographics Similar to Immigrants from Iran by Single Father Poverty
In terms of single father poverty, the demographic groups most similar to Immigrants from Iran are Sri Lankan (14.2%, a difference of 0.20%), Immigrants from Vietnam (14.1%, a difference of 0.26%), Immigrants from Hong Kong (14.2%, a difference of 0.45%), Soviet Union (14.3%, a difference of 0.48%), and Immigrants from Iraq (14.3%, a difference of 0.52%).
| Demographics | Rating | Rank | Single Father Poverty |
| Afghans | 100.0 /100 | #9 | Exceptional 14.0% |
| Koreans | 100.0 /100 | #10 | Exceptional 14.0% |
| Filipinos | 100.0 /100 | #11 | Exceptional 14.0% |
| Immigrants | India | 100.0 /100 | #12 | Exceptional 14.0% |
| Immigrants | Philippines | 100.0 /100 | #13 | Exceptional 14.0% |
| Immigrants | Vietnam | 100.0 /100 | #14 | Exceptional 14.1% |
| Sri Lankans | 100.0 /100 | #15 | Exceptional 14.2% |
| Immigrants | Iran | 100.0 /100 | #16 | Exceptional 14.2% |
| Immigrants | Hong Kong | 100.0 /100 | #17 | Exceptional 14.2% |
| Soviet Union | 100.0 /100 | #18 | Exceptional 14.3% |
| Immigrants | Iraq | 100.0 /100 | #19 | Exceptional 14.3% |
| Immigrants | Singapore | 100.0 /100 | #20 | Exceptional 14.3% |
| Immigrants | Afghanistan | 100.0 /100 | #21 | Exceptional 14.3% |
| Taiwanese | 100.0 /100 | #22 | Exceptional 14.3% |
| Immigrants | Egypt | 100.0 /100 | #23 | Exceptional 14.4% |