Puget Sound Salish vs Immigrants from Iran Single Father Poverty
COMPARE
Puget Sound Salish
Immigrants from Iran
Single Father Poverty
Single Father Poverty Comparison
Puget Sound Salish
Immigrants from Iran
15.2%
SINGLE FATHER POVERTY
99.8/ 100
METRIC RATING
60th/ 347
METRIC RANK
14.2%
SINGLE FATHER POVERTY
100.0/ 100
METRIC RATING
16th/ 347
METRIC RANK
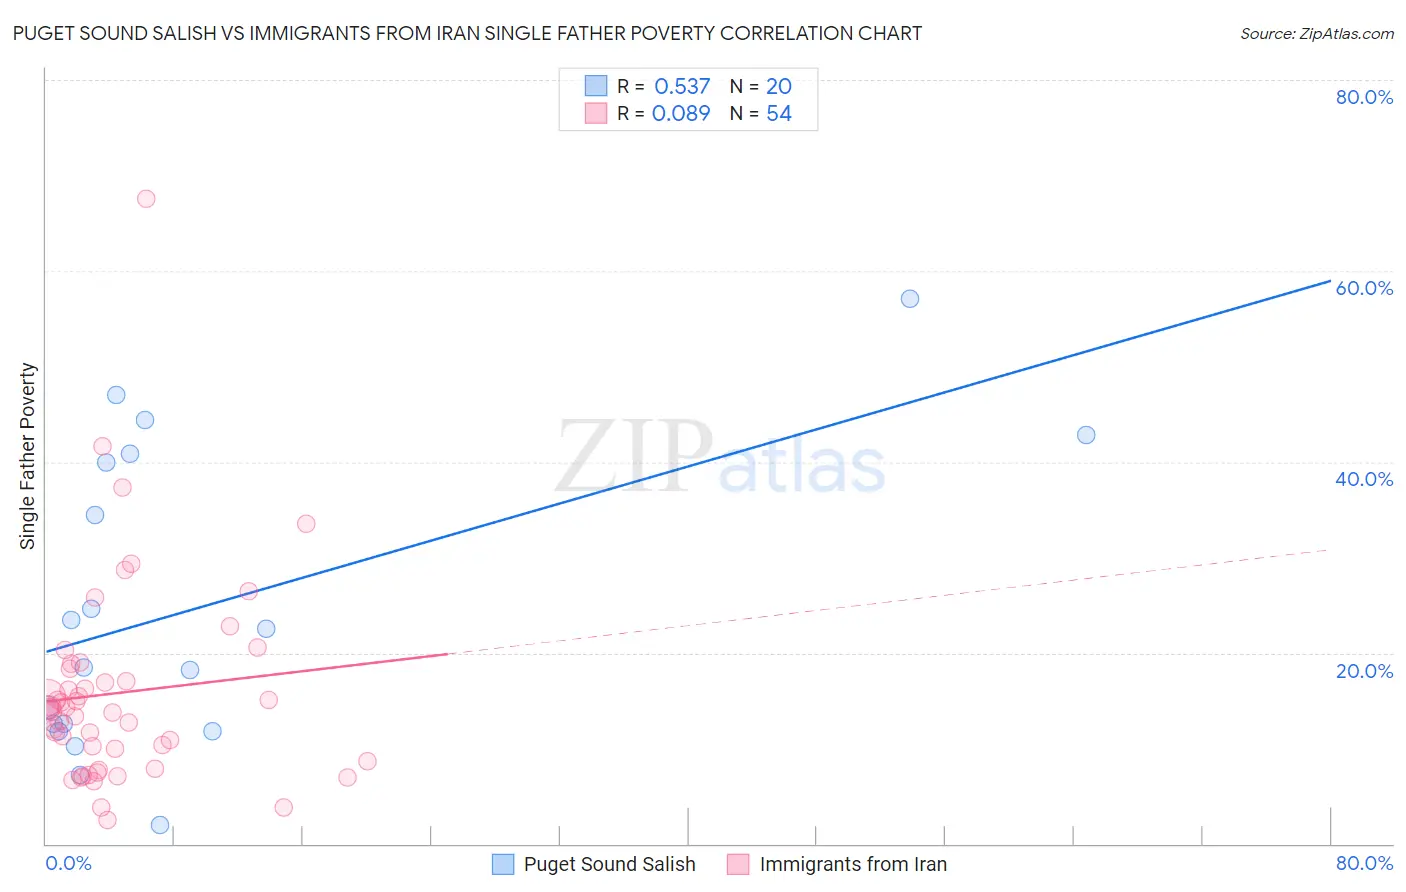
Puget Sound Salish vs Immigrants from Iran Single Father Poverty Correlation Chart
The statistical analysis conducted on geographies consisting of 42,233,093 people shows a substantial positive correlation between the proportion of Puget Sound Salish and poverty level among single fathers in the United States with a correlation coefficient (R) of 0.537 and weighted average of 15.2%. Similarly, the statistical analysis conducted on geographies consisting of 227,784,696 people shows a slight positive correlation between the proportion of Immigrants from Iran and poverty level among single fathers in the United States with a correlation coefficient (R) of 0.089 and weighted average of 14.2%, a difference of 6.9%.
Single Father Poverty Correlation Summary
| Measurement | Puget Sound Salish | Immigrants from Iran |
| Minimum | 2.0% | 2.4% |
| Maximum | 57.1% | 67.6% |
| Range | 55.1% | 65.1% |
| Mean | 24.8% | 15.8% |
| Median | 20.5% | 14.0% |
| Interquartile 25% (IQ1) | 12.2% | 8.7% |
| Interquartile 75% (IQ3) | 40.5% | 18.3% |
| Interquartile Range (IQR) | 28.3% | 9.6% |
| Standard Deviation (Sample) | 15.8% | 10.9% |
| Standard Deviation (Population) | 15.4% | 10.8% |
Similar Demographics by Single Father Poverty
Demographics Similar to Puget Sound Salish by Single Father Poverty
In terms of single father poverty, the demographic groups most similar to Puget Sound Salish are Immigrants from Bosnia and Herzegovina (15.2%, a difference of 0.040%), Immigrants from Armenia (15.2%, a difference of 0.050%), Immigrants from Sweden (15.2%, a difference of 0.14%), Bangladeshi (15.2%, a difference of 0.22%), and Immigrants from Malaysia (15.2%, a difference of 0.31%).
| Demographics | Rating | Rank | Single Father Poverty |
| Immigrants | Kenya | 99.9 /100 | #53 | Exceptional 15.0% |
| Immigrants | Uzbekistan | 99.9 /100 | #54 | Exceptional 15.0% |
| Immigrants | Bulgaria | 99.9 /100 | #55 | Exceptional 15.0% |
| Immigrants | Laos | 99.9 /100 | #56 | Exceptional 15.1% |
| Laotians | 99.9 /100 | #57 | Exceptional 15.1% |
| Hawaiians | 99.9 /100 | #58 | Exceptional 15.1% |
| Guamanians/Chamorros | 99.9 /100 | #59 | Exceptional 15.1% |
| Puget Sound Salish | 99.8 /100 | #60 | Exceptional 15.2% |
| Immigrants | Bosnia and Herzegovina | 99.8 /100 | #61 | Exceptional 15.2% |
| Immigrants | Armenia | 99.8 /100 | #62 | Exceptional 15.2% |
| Immigrants | Sweden | 99.8 /100 | #63 | Exceptional 15.2% |
| Bangladeshis | 99.8 /100 | #64 | Exceptional 15.2% |
| Immigrants | Malaysia | 99.8 /100 | #65 | Exceptional 15.2% |
| Immigrants | Moldova | 99.8 /100 | #66 | Exceptional 15.2% |
| Paraguayans | 99.7 /100 | #67 | Exceptional 15.2% |
Demographics Similar to Immigrants from Iran by Single Father Poverty
In terms of single father poverty, the demographic groups most similar to Immigrants from Iran are Sri Lankan (14.2%, a difference of 0.20%), Immigrants from Vietnam (14.1%, a difference of 0.26%), Immigrants from Hong Kong (14.2%, a difference of 0.45%), Soviet Union (14.3%, a difference of 0.48%), and Immigrants from Iraq (14.3%, a difference of 0.52%).
| Demographics | Rating | Rank | Single Father Poverty |
| Afghans | 100.0 /100 | #9 | Exceptional 14.0% |
| Koreans | 100.0 /100 | #10 | Exceptional 14.0% |
| Filipinos | 100.0 /100 | #11 | Exceptional 14.0% |
| Immigrants | India | 100.0 /100 | #12 | Exceptional 14.0% |
| Immigrants | Philippines | 100.0 /100 | #13 | Exceptional 14.0% |
| Immigrants | Vietnam | 100.0 /100 | #14 | Exceptional 14.1% |
| Sri Lankans | 100.0 /100 | #15 | Exceptional 14.2% |
| Immigrants | Iran | 100.0 /100 | #16 | Exceptional 14.2% |
| Immigrants | Hong Kong | 100.0 /100 | #17 | Exceptional 14.2% |
| Soviet Union | 100.0 /100 | #18 | Exceptional 14.3% |
| Immigrants | Iraq | 100.0 /100 | #19 | Exceptional 14.3% |
| Immigrants | Singapore | 100.0 /100 | #20 | Exceptional 14.3% |
| Immigrants | Afghanistan | 100.0 /100 | #21 | Exceptional 14.3% |
| Taiwanese | 100.0 /100 | #22 | Exceptional 14.3% |
| Immigrants | Egypt | 100.0 /100 | #23 | Exceptional 14.4% |