Immigrants from Burma/Myanmar vs Immigrants from Iran Doctorate Degree
COMPARE
Immigrants from Burma/Myanmar
Immigrants from Iran
Doctorate Degree
Doctorate Degree Comparison
Immigrants from Burma/Myanmar
Immigrants from Iran
1.7%
DOCTORATE DEGREE
13.5/ 100
METRIC RATING
216th/ 347
METRIC RANK
3.0%
DOCTORATE DEGREE
100.0/ 100
METRIC RATING
9th/ 347
METRIC RANK
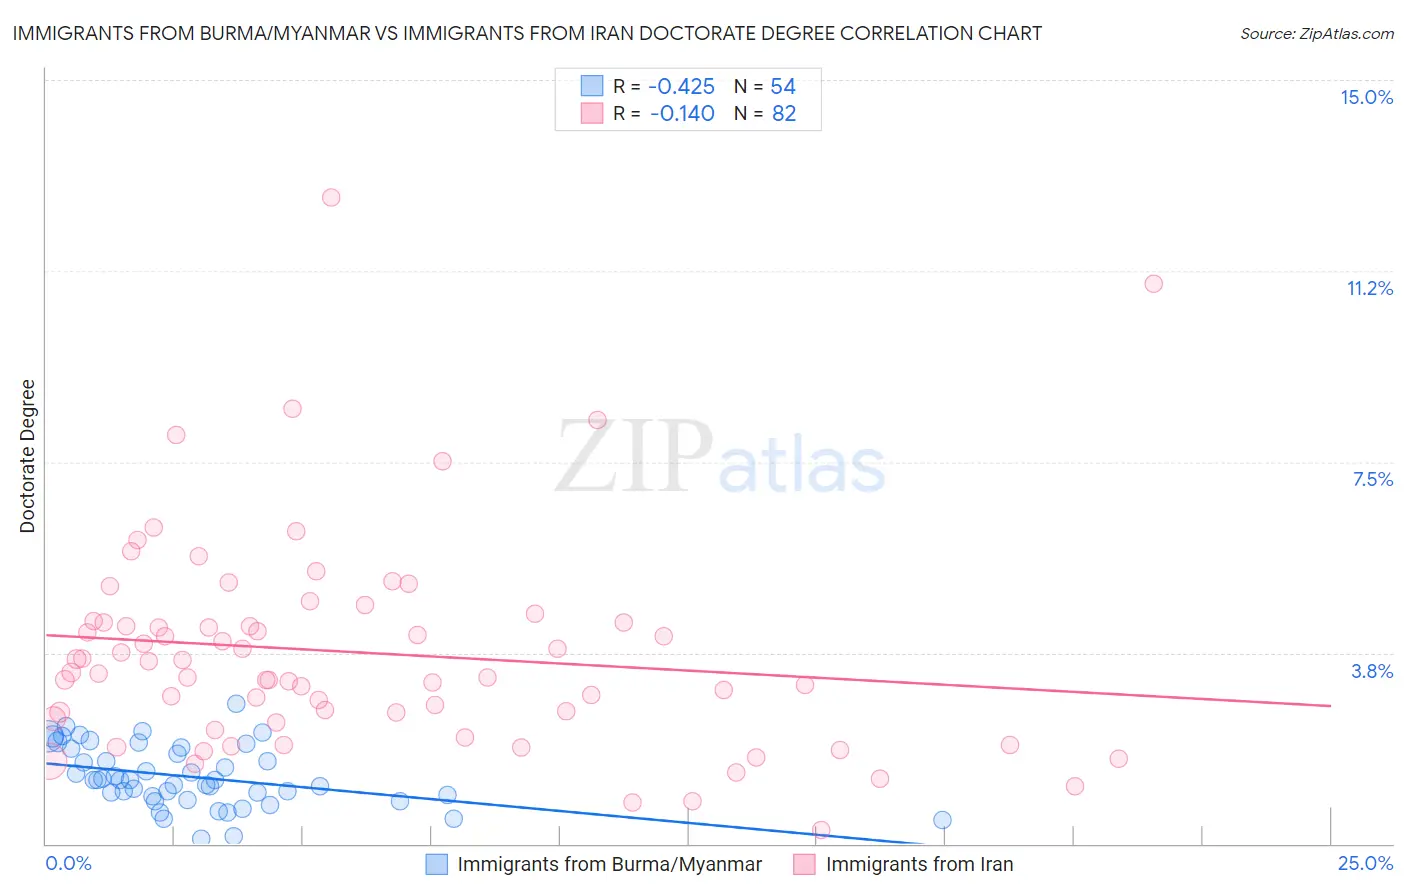
Immigrants from Burma/Myanmar vs Immigrants from Iran Doctorate Degree Correlation Chart
The statistical analysis conducted on geographies consisting of 171,860,396 people shows a moderate negative correlation between the proportion of Immigrants from Burma/Myanmar and percentage of population with at least doctorate degree education in the United States with a correlation coefficient (R) of -0.425 and weighted average of 1.7%. Similarly, the statistical analysis conducted on geographies consisting of 279,321,520 people shows a poor negative correlation between the proportion of Immigrants from Iran and percentage of population with at least doctorate degree education in the United States with a correlation coefficient (R) of -0.140 and weighted average of 3.0%, a difference of 76.6%.
Doctorate Degree Correlation Summary
| Measurement | Immigrants from Burma/Myanmar | Immigrants from Iran |
| Minimum | 0.089% | 0.26% |
| Maximum | 2.7% | 12.7% |
| Range | 2.7% | 12.4% |
| Mean | 1.3% | 3.8% |
| Median | 1.3% | 3.4% |
| Interquartile 25% (IQ1) | 0.93% | 2.5% |
| Interquartile 75% (IQ3) | 1.9% | 4.4% |
| Interquartile Range (IQR) | 0.94% | 1.9% |
| Standard Deviation (Sample) | 0.60% | 2.1% |
| Standard Deviation (Population) | 0.59% | 2.1% |
Similar Demographics by Doctorate Degree
Demographics Similar to Immigrants from Burma/Myanmar by Doctorate Degree
In terms of doctorate degree, the demographic groups most similar to Immigrants from Burma/Myanmar are Alaskan Athabascan (1.7%, a difference of 0.10%), Spanish American (1.7%, a difference of 0.21%), Pueblo (1.7%, a difference of 0.24%), Korean (1.7%, a difference of 0.25%), and Immigrants from South Eastern Asia (1.7%, a difference of 0.39%).
| Demographics | Rating | Rank | Doctorate Degree |
| Immigrants | Western Africa | 15.4 /100 | #209 | Poor 1.7% |
| Tongans | 15.1 /100 | #210 | Poor 1.7% |
| Immigrants | Armenia | 15.1 /100 | #211 | Poor 1.7% |
| Immigrants | South Eastern Asia | 14.7 /100 | #212 | Poor 1.7% |
| Koreans | 14.2 /100 | #213 | Poor 1.7% |
| Pueblo | 14.2 /100 | #214 | Poor 1.7% |
| Alaskan Athabascans | 13.8 /100 | #215 | Poor 1.7% |
| Immigrants | Burma/Myanmar | 13.5 /100 | #216 | Poor 1.7% |
| Spanish Americans | 12.9 /100 | #217 | Poor 1.7% |
| Tlingit-Haida | 11.9 /100 | #218 | Poor 1.7% |
| Immigrants | Iraq | 10.7 /100 | #219 | Poor 1.7% |
| Immigrants | Uruguay | 9.2 /100 | #220 | Tragic 1.7% |
| Immigrants | Nonimmigrants | 8.8 /100 | #221 | Tragic 1.7% |
| Immigrants | Venezuela | 8.7 /100 | #222 | Tragic 1.7% |
| Immigrants | Bosnia and Herzegovina | 7.8 /100 | #223 | Tragic 1.7% |
Demographics Similar to Immigrants from Iran by Doctorate Degree
In terms of doctorate degree, the demographic groups most similar to Immigrants from Iran are Immigrants from Israel (3.0%, a difference of 0.67%), Immigrants from China (3.1%, a difference of 2.0%), Immigrants from Switzerland (3.1%, a difference of 2.1%), Immigrants from Eastern Asia (3.0%, a difference of 2.1%), and Iranian (3.1%, a difference of 4.0%).
| Demographics | Rating | Rank | Doctorate Degree |
| Filipinos | 100.0 /100 | #2 | Exceptional 3.4% |
| Okinawans | 100.0 /100 | #3 | Exceptional 3.3% |
| Immigrants | Taiwan | 100.0 /100 | #4 | Exceptional 3.2% |
| Iranians | 100.0 /100 | #5 | Exceptional 3.1% |
| Immigrants | Switzerland | 100.0 /100 | #6 | Exceptional 3.1% |
| Immigrants | China | 100.0 /100 | #7 | Exceptional 3.1% |
| Immigrants | Israel | 100.0 /100 | #8 | Exceptional 3.0% |
| Immigrants | Iran | 100.0 /100 | #9 | Exceptional 3.0% |
| Immigrants | Eastern Asia | 100.0 /100 | #10 | Exceptional 3.0% |
| Indians (Asian) | 100.0 /100 | #11 | Exceptional 2.9% |
| Immigrants | Belgium | 100.0 /100 | #12 | Exceptional 2.9% |
| Immigrants | Sweden | 100.0 /100 | #13 | Exceptional 2.9% |
| Immigrants | France | 100.0 /100 | #14 | Exceptional 2.9% |
| Immigrants | India | 100.0 /100 | #15 | Exceptional 2.8% |
| Eastern Europeans | 100.0 /100 | #16 | Exceptional 2.8% |