Immigrants from Burma/Myanmar vs Immigrants from Russia Single Father Poverty
COMPARE
Immigrants from Burma/Myanmar
Immigrants from Russia
Single Father Poverty
Single Father Poverty Comparison
Immigrants from Burma/Myanmar
Immigrants from Russia
16.5%
SINGLE FATHER POVERTY
28.0/ 100
METRIC RATING
190th/ 347
METRIC RANK
15.5%
SINGLE FATHER POVERTY
99.0/ 100
METRIC RATING
86th/ 347
METRIC RANK
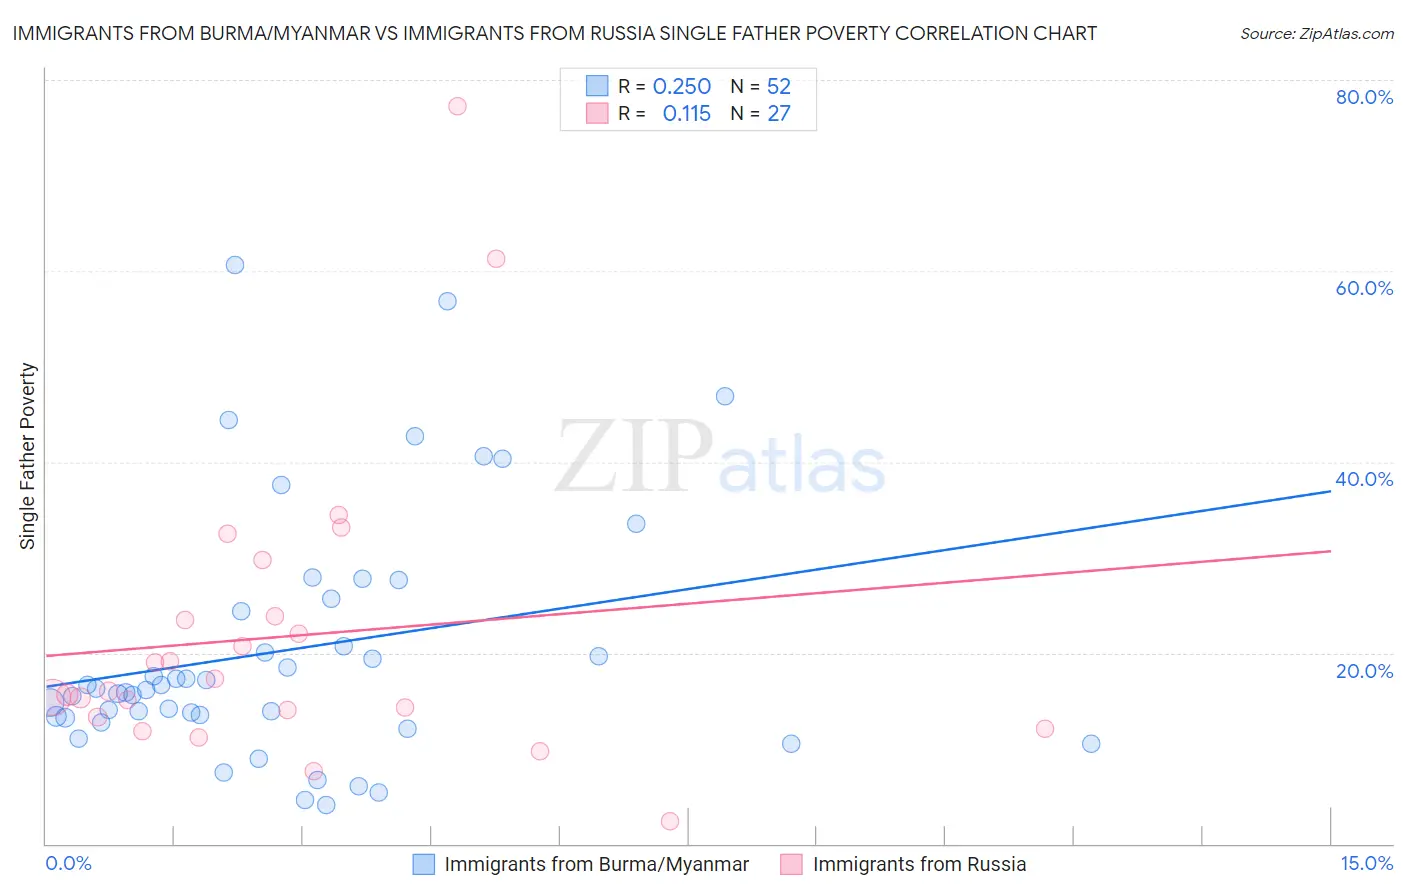
Immigrants from Burma/Myanmar vs Immigrants from Russia Single Father Poverty Correlation Chart
The statistical analysis conducted on geographies consisting of 151,197,682 people shows a weak positive correlation between the proportion of Immigrants from Burma/Myanmar and poverty level among single fathers in the United States with a correlation coefficient (R) of 0.250 and weighted average of 16.5%. Similarly, the statistical analysis conducted on geographies consisting of 273,488,054 people shows a poor positive correlation between the proportion of Immigrants from Russia and poverty level among single fathers in the United States with a correlation coefficient (R) of 0.115 and weighted average of 15.5%, a difference of 6.5%.
Single Father Poverty Correlation Summary
| Measurement | Immigrants from Burma/Myanmar | Immigrants from Russia |
| Minimum | 4.1% | 2.4% |
| Maximum | 60.6% | 77.3% |
| Range | 56.5% | 74.9% |
| Mean | 20.3% | 21.7% |
| Median | 16.1% | 15.9% |
| Interquartile 25% (IQ1) | 13.3% | 13.3% |
| Interquartile 75% (IQ3) | 25.0% | 23.9% |
| Interquartile Range (IQR) | 11.8% | 10.6% |
| Standard Deviation (Sample) | 13.0% | 15.9% |
| Standard Deviation (Population) | 12.9% | 15.6% |
Similar Demographics by Single Father Poverty
Demographics Similar to Immigrants from Burma/Myanmar by Single Father Poverty
In terms of single father poverty, the demographic groups most similar to Immigrants from Burma/Myanmar are Latvian (16.5%, a difference of 0.050%), Immigrants from Guyana (16.5%, a difference of 0.050%), Russian (16.4%, a difference of 0.11%), Ukrainian (16.4%, a difference of 0.12%), and Immigrants from Venezuela (16.4%, a difference of 0.16%).
| Demographics | Rating | Rank | Single Father Poverty |
| Aleuts | 35.3 /100 | #183 | Fair 16.4% |
| Cambodians | 34.6 /100 | #184 | Fair 16.4% |
| Panamanians | 33.6 /100 | #185 | Fair 16.4% |
| Immigrants | Venezuela | 31.0 /100 | #186 | Fair 16.4% |
| Ukrainians | 30.4 /100 | #187 | Fair 16.4% |
| Russians | 30.1 /100 | #188 | Fair 16.4% |
| Latvians | 28.9 /100 | #189 | Fair 16.5% |
| Immigrants | Burma/Myanmar | 28.0 /100 | #190 | Fair 16.5% |
| Immigrants | Guyana | 27.1 /100 | #191 | Fair 16.5% |
| Immigrants | Switzerland | 24.8 /100 | #192 | Fair 16.5% |
| Ecuadorians | 24.5 /100 | #193 | Fair 16.5% |
| Cape Verdeans | 24.4 /100 | #194 | Fair 16.5% |
| Immigrants | Barbados | 24.3 /100 | #195 | Fair 16.5% |
| Immigrants | Canada | 21.9 /100 | #196 | Fair 16.5% |
| Immigrants | Northern Europe | 20.3 /100 | #197 | Fair 16.5% |
Demographics Similar to Immigrants from Russia by Single Father Poverty
In terms of single father poverty, the demographic groups most similar to Immigrants from Russia are Brazilian (15.5%, a difference of 0.0%), Burmese (15.5%, a difference of 0.040%), Immigrants from Korea (15.5%, a difference of 0.10%), Immigrants from Oceania (15.4%, a difference of 0.12%), and Peruvian (15.4%, a difference of 0.24%).
| Demographics | Rating | Rank | Single Father Poverty |
| Immigrants | Northern Africa | 99.5 /100 | #79 | Exceptional 15.3% |
| Armenians | 99.4 /100 | #80 | Exceptional 15.4% |
| Immigrants | Congo | 99.4 /100 | #81 | Exceptional 15.4% |
| Immigrants | Ukraine | 99.4 /100 | #82 | Exceptional 15.4% |
| Chinese | 99.3 /100 | #83 | Exceptional 15.4% |
| Peruvians | 99.2 /100 | #84 | Exceptional 15.4% |
| Immigrants | Oceania | 99.1 /100 | #85 | Exceptional 15.4% |
| Immigrants | Russia | 99.0 /100 | #86 | Exceptional 15.5% |
| Brazilians | 99.0 /100 | #87 | Exceptional 15.5% |
| Burmese | 99.0 /100 | #88 | Exceptional 15.5% |
| Immigrants | Korea | 99.0 /100 | #89 | Exceptional 15.5% |
| Mexican American Indians | 98.7 /100 | #90 | Exceptional 15.5% |
| Immigrants | Romania | 98.6 /100 | #91 | Exceptional 15.5% |
| Immigrants | Serbia | 98.5 /100 | #92 | Exceptional 15.5% |
| Basques | 98.4 /100 | #93 | Exceptional 15.5% |