Comanche vs Immigrants from Iran Single Father Poverty
COMPARE
Comanche
Immigrants from Iran
Single Father Poverty
Single Father Poverty Comparison
Comanche
Immigrants from Iran
18.5%
SINGLE FATHER POVERTY
0.0/ 100
METRIC RATING
302nd/ 347
METRIC RANK
14.2%
SINGLE FATHER POVERTY
100.0/ 100
METRIC RATING
16th/ 347
METRIC RANK
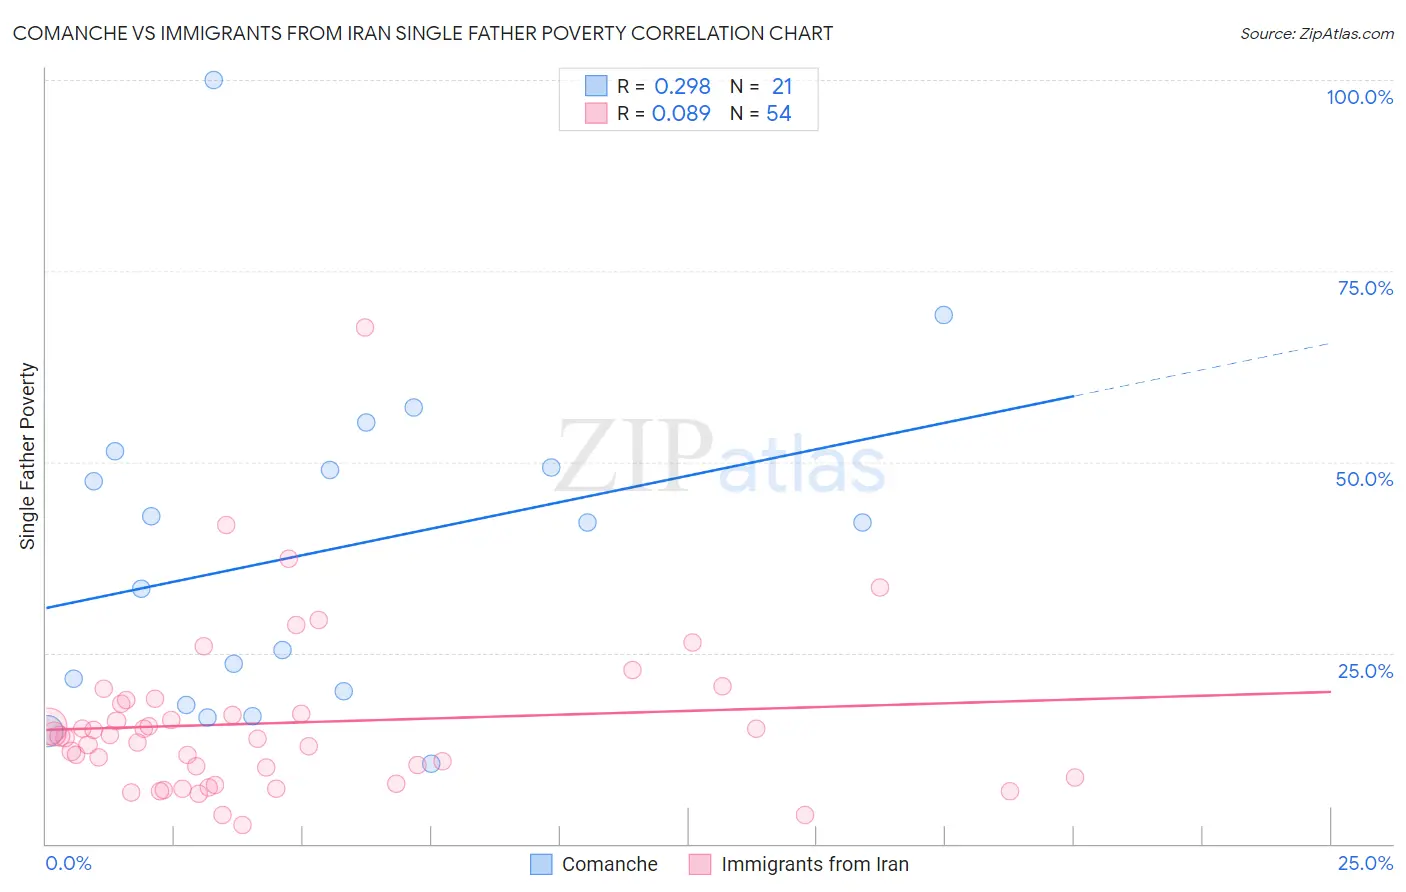
Comanche vs Immigrants from Iran Single Father Poverty Correlation Chart
The statistical analysis conducted on geographies consisting of 100,339,334 people shows a weak positive correlation between the proportion of Comanche and poverty level among single fathers in the United States with a correlation coefficient (R) of 0.298 and weighted average of 18.5%. Similarly, the statistical analysis conducted on geographies consisting of 227,784,696 people shows a slight positive correlation between the proportion of Immigrants from Iran and poverty level among single fathers in the United States with a correlation coefficient (R) of 0.089 and weighted average of 14.2%, a difference of 30.3%.
Single Father Poverty Correlation Summary
| Measurement | Comanche | Immigrants from Iran |
| Minimum | 10.5% | 2.4% |
| Maximum | 100.0% | 67.6% |
| Range | 89.5% | 65.1% |
| Mean | 38.4% | 15.8% |
| Median | 42.1% | 14.0% |
| Interquartile 25% (IQ1) | 19.1% | 8.7% |
| Interquartile 75% (IQ3) | 50.3% | 18.3% |
| Interquartile Range (IQR) | 31.2% | 9.6% |
| Standard Deviation (Sample) | 21.9% | 10.9% |
| Standard Deviation (Population) | 21.4% | 10.8% |
Similar Demographics by Single Father Poverty
Demographics Similar to Comanche by Single Father Poverty
In terms of single father poverty, the demographic groups most similar to Comanche are Celtic (18.5%, a difference of 0.040%), Hungarian (18.5%, a difference of 0.11%), Ute (18.5%, a difference of 0.18%), Blackfeet (18.5%, a difference of 0.23%), and Immigrants from Dominican Republic (18.4%, a difference of 0.32%).
| Demographics | Rating | Rank | Single Father Poverty |
| Yakama | 0.0 /100 | #295 | Tragic 18.1% |
| Seminole | 0.0 /100 | #296 | Tragic 18.1% |
| French | 0.0 /100 | #297 | Tragic 18.2% |
| Africans | 0.0 /100 | #298 | Tragic 18.3% |
| Whites/Caucasians | 0.0 /100 | #299 | Tragic 18.4% |
| Immigrants | Dominican Republic | 0.0 /100 | #300 | Tragic 18.4% |
| Hungarians | 0.0 /100 | #301 | Tragic 18.5% |
| Comanche | 0.0 /100 | #302 | Tragic 18.5% |
| Celtics | 0.0 /100 | #303 | Tragic 18.5% |
| Ute | 0.0 /100 | #304 | Tragic 18.5% |
| Blackfeet | 0.0 /100 | #305 | Tragic 18.5% |
| Scotch-Irish | 0.0 /100 | #306 | Tragic 18.6% |
| French Canadians | 0.0 /100 | #307 | Tragic 18.6% |
| Ottawa | 0.0 /100 | #308 | Tragic 18.6% |
| Immigrants | Micronesia | 0.0 /100 | #309 | Tragic 18.6% |
Demographics Similar to Immigrants from Iran by Single Father Poverty
In terms of single father poverty, the demographic groups most similar to Immigrants from Iran are Sri Lankan (14.2%, a difference of 0.20%), Immigrants from Vietnam (14.1%, a difference of 0.26%), Immigrants from Hong Kong (14.2%, a difference of 0.45%), Soviet Union (14.3%, a difference of 0.48%), and Immigrants from Iraq (14.3%, a difference of 0.52%).
| Demographics | Rating | Rank | Single Father Poverty |
| Afghans | 100.0 /100 | #9 | Exceptional 14.0% |
| Koreans | 100.0 /100 | #10 | Exceptional 14.0% |
| Filipinos | 100.0 /100 | #11 | Exceptional 14.0% |
| Immigrants | India | 100.0 /100 | #12 | Exceptional 14.0% |
| Immigrants | Philippines | 100.0 /100 | #13 | Exceptional 14.0% |
| Immigrants | Vietnam | 100.0 /100 | #14 | Exceptional 14.1% |
| Sri Lankans | 100.0 /100 | #15 | Exceptional 14.2% |
| Immigrants | Iran | 100.0 /100 | #16 | Exceptional 14.2% |
| Immigrants | Hong Kong | 100.0 /100 | #17 | Exceptional 14.2% |
| Soviet Union | 100.0 /100 | #18 | Exceptional 14.3% |
| Immigrants | Iraq | 100.0 /100 | #19 | Exceptional 14.3% |
| Immigrants | Singapore | 100.0 /100 | #20 | Exceptional 14.3% |
| Immigrants | Afghanistan | 100.0 /100 | #21 | Exceptional 14.3% |
| Taiwanese | 100.0 /100 | #22 | Exceptional 14.3% |
| Immigrants | Egypt | 100.0 /100 | #23 | Exceptional 14.4% |