Immigrants from Bulgaria vs Jordanian Female Poverty Among 25-34 Year Olds
COMPARE
Immigrants from Bulgaria
Jordanian
Female Poverty Among 25-34 Year Olds
Female Poverty Among 25-34 Year Olds Comparison
Immigrants from Bulgaria
Jordanians
11.8%
FEMALE POVERTY AMONG 25-34 YEAR OLDS
99.8/ 100
METRIC RATING
40th/ 347
METRIC RANK
12.1%
FEMALE POVERTY AMONG 25-34 YEAR OLDS
99.4/ 100
METRIC RATING
57th/ 347
METRIC RANK
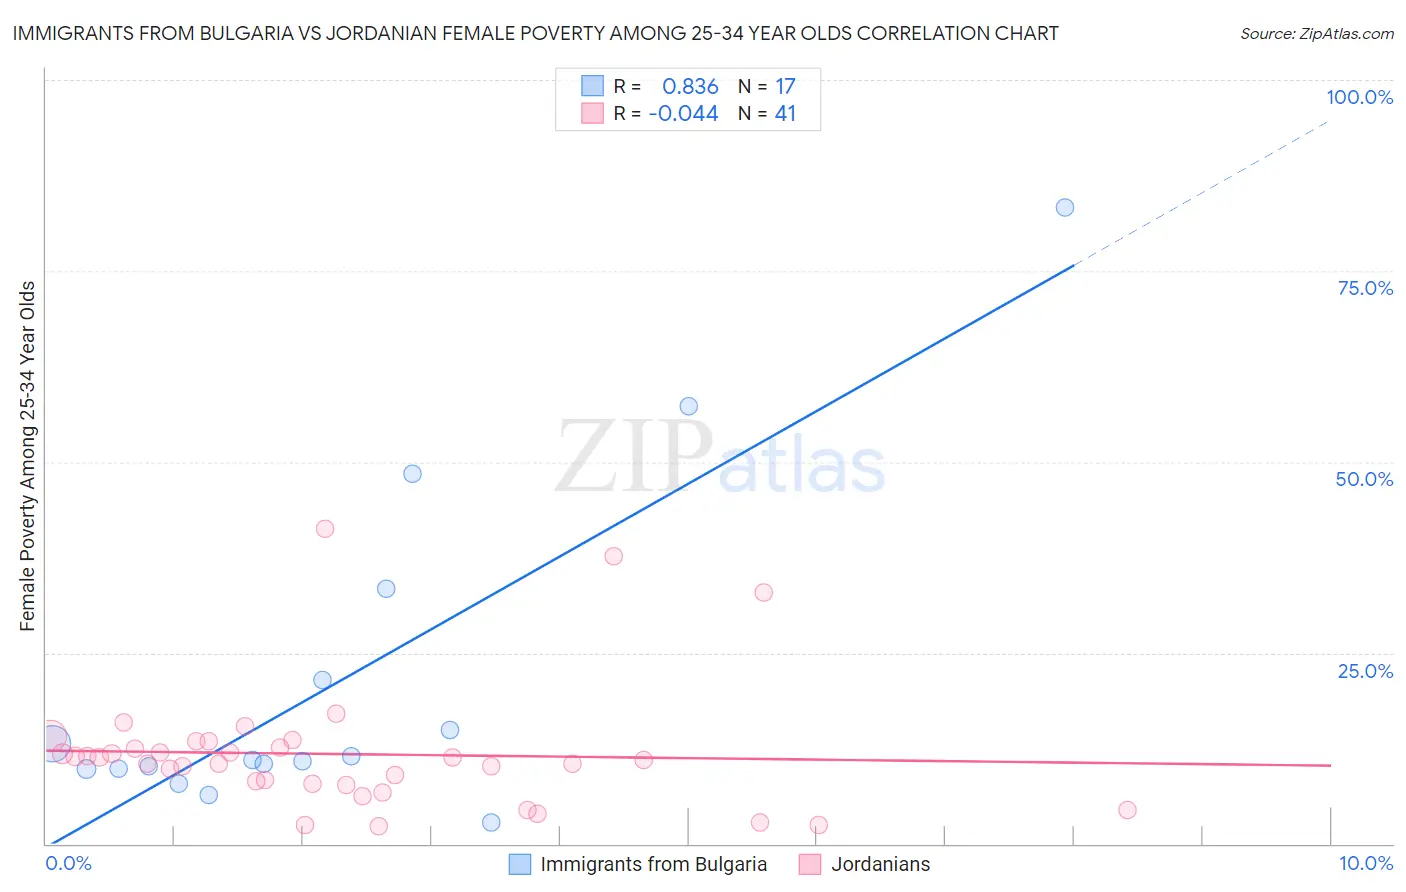
Immigrants from Bulgaria vs Jordanian Female Poverty Among 25-34 Year Olds Correlation Chart
The statistical analysis conducted on geographies consisting of 171,069,658 people shows a very strong positive correlation between the proportion of Immigrants from Bulgaria and poverty level among females between the ages 25 and 34 in the United States with a correlation coefficient (R) of 0.836 and weighted average of 11.8%. Similarly, the statistical analysis conducted on geographies consisting of 165,610,888 people shows no correlation between the proportion of Jordanians and poverty level among females between the ages 25 and 34 in the United States with a correlation coefficient (R) of -0.044 and weighted average of 12.1%, a difference of 2.1%.
Female Poverty Among 25-34 Year Olds Correlation Summary
| Measurement | Immigrants from Bulgaria | Jordanian |
| Minimum | 2.9% | 2.3% |
| Maximum | 83.3% | 41.2% |
| Range | 80.5% | 39.0% |
| Mean | 21.3% | 11.7% |
| Median | 11.0% | 11.0% |
| Interquartile 25% (IQ1) | 9.8% | 7.8% |
| Interquartile 75% (IQ3) | 27.4% | 13.0% |
| Interquartile Range (IQR) | 17.6% | 5.2% |
| Standard Deviation (Sample) | 21.9% | 8.2% |
| Standard Deviation (Population) | 21.3% | 8.1% |
Demographics Similar to Immigrants from Bulgaria and Jordanians by Female Poverty Among 25-34 Year Olds
In terms of female poverty among 25-34 year olds, the demographic groups most similar to Immigrants from Bulgaria are Immigrants from Indonesia (11.8%, a difference of 0.13%), Latvian (11.8%, a difference of 0.16%), Immigrants from North Macedonia (11.8%, a difference of 0.41%), Immigrants from Turkey (11.9%, a difference of 0.42%), and Egyptian (11.9%, a difference of 0.68%). Similarly, the demographic groups most similar to Jordanians are Luxembourger (12.1%, a difference of 0.020%), Immigrants from Romania (12.1%, a difference of 0.21%), Immigrants from Philippines (12.0%, a difference of 0.35%), Eastern European (12.0%, a difference of 0.52%), and Immigrants from Israel (12.0%, a difference of 0.64%).
| Demographics | Rating | Rank | Female Poverty Among 25-34 Year Olds |
| Immigrants | North Macedonia | 99.8 /100 | #38 | Exceptional 11.8% |
| Latvians | 99.8 /100 | #39 | Exceptional 11.8% |
| Immigrants | Bulgaria | 99.8 /100 | #40 | Exceptional 11.8% |
| Immigrants | Indonesia | 99.8 /100 | #41 | Exceptional 11.8% |
| Immigrants | Turkey | 99.7 /100 | #42 | Exceptional 11.9% |
| Egyptians | 99.7 /100 | #43 | Exceptional 11.9% |
| Immigrants | Australia | 99.7 /100 | #44 | Exceptional 11.9% |
| Macedonians | 99.7 /100 | #45 | Exceptional 11.9% |
| Immigrants | Serbia | 99.7 /100 | #46 | Exceptional 11.9% |
| Koreans | 99.6 /100 | #47 | Exceptional 12.0% |
| Immigrants | Belarus | 99.6 /100 | #48 | Exceptional 12.0% |
| Immigrants | Egypt | 99.6 /100 | #49 | Exceptional 12.0% |
| Immigrants | Croatia | 99.6 /100 | #50 | Exceptional 12.0% |
| Paraguayans | 99.6 /100 | #51 | Exceptional 12.0% |
| Immigrants | Eastern Europe | 99.6 /100 | #52 | Exceptional 12.0% |
| Immigrants | Israel | 99.6 /100 | #53 | Exceptional 12.0% |
| Eastern Europeans | 99.6 /100 | #54 | Exceptional 12.0% |
| Immigrants | Philippines | 99.5 /100 | #55 | Exceptional 12.0% |
| Luxembourgers | 99.5 /100 | #56 | Exceptional 12.1% |
| Jordanians | 99.4 /100 | #57 | Exceptional 12.1% |
| Immigrants | Romania | 99.4 /100 | #58 | Exceptional 12.1% |