Immigrants from Bulgaria vs Cheyenne Single Female Poverty
COMPARE
Immigrants from Bulgaria
Cheyenne
Single Female Poverty
Single Female Poverty Comparison
Immigrants from Bulgaria
Cheyenne
19.1%
SINGLE FEMALE POVERTY
99.7/ 100
METRIC RATING
58th/ 347
METRIC RANK
30.4%
SINGLE FEMALE POVERTY
0.0/ 100
METRIC RATING
339th/ 347
METRIC RANK
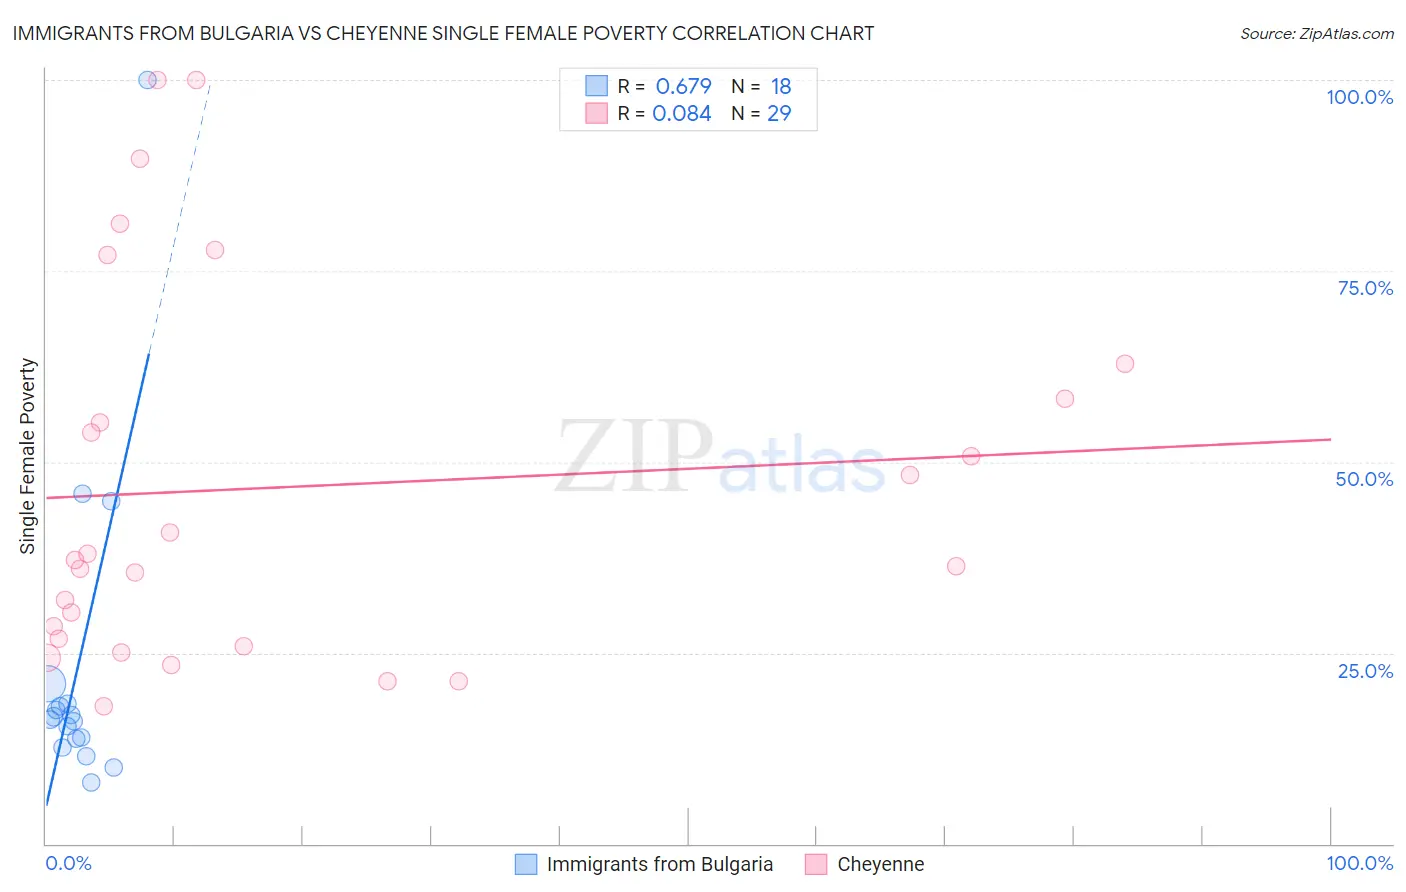
Immigrants from Bulgaria vs Cheyenne Single Female Poverty Correlation Chart
The statistical analysis conducted on geographies consisting of 171,131,313 people shows a significant positive correlation between the proportion of Immigrants from Bulgaria and poverty level among single females in the United States with a correlation coefficient (R) of 0.679 and weighted average of 19.1%. Similarly, the statistical analysis conducted on geographies consisting of 80,467,038 people shows a slight positive correlation between the proportion of Cheyenne and poverty level among single females in the United States with a correlation coefficient (R) of 0.084 and weighted average of 30.4%, a difference of 58.7%.
Single Female Poverty Correlation Summary
| Measurement | Immigrants from Bulgaria | Cheyenne |
| Minimum | 8.1% | 18.0% |
| Maximum | 100.0% | 100.0% |
| Range | 91.9% | 82.0% |
| Mean | 23.1% | 46.7% |
| Median | 16.4% | 37.1% |
| Interquartile 25% (IQ1) | 13.7% | 26.3% |
| Interquartile 75% (IQ3) | 18.3% | 60.6% |
| Interquartile Range (IQR) | 4.6% | 34.3% |
| Standard Deviation (Sample) | 21.8% | 24.6% |
| Standard Deviation (Population) | 21.1% | 24.2% |
Similar Demographics by Single Female Poverty
Demographics Similar to Immigrants from Bulgaria by Single Female Poverty
In terms of single female poverty, the demographic groups most similar to Immigrants from Bulgaria are Sri Lankan (19.2%, a difference of 0.10%), Eastern European (19.1%, a difference of 0.12%), Immigrants from Fiji (19.1%, a difference of 0.18%), Russian (19.2%, a difference of 0.20%), and Cambodian (19.2%, a difference of 0.22%).
| Demographics | Rating | Rank | Single Female Poverty |
| Immigrants | Italy | 99.8 /100 | #51 | Exceptional 19.0% |
| Egyptians | 99.7 /100 | #52 | Exceptional 19.1% |
| Tsimshian | 99.7 /100 | #53 | Exceptional 19.1% |
| Argentineans | 99.7 /100 | #54 | Exceptional 19.1% |
| Immigrants | Vietnam | 99.7 /100 | #55 | Exceptional 19.1% |
| Immigrants | Fiji | 99.7 /100 | #56 | Exceptional 19.1% |
| Eastern Europeans | 99.7 /100 | #57 | Exceptional 19.1% |
| Immigrants | Bulgaria | 99.7 /100 | #58 | Exceptional 19.1% |
| Sri Lankans | 99.6 /100 | #59 | Exceptional 19.2% |
| Russians | 99.6 /100 | #60 | Exceptional 19.2% |
| Cambodians | 99.6 /100 | #61 | Exceptional 19.2% |
| Lithuanians | 99.6 /100 | #62 | Exceptional 19.2% |
| Immigrants | Northern Europe | 99.6 /100 | #63 | Exceptional 19.2% |
| Immigrants | Europe | 99.6 /100 | #64 | Exceptional 19.2% |
| Cypriots | 99.6 /100 | #65 | Exceptional 19.2% |
Demographics Similar to Cheyenne by Single Female Poverty
In terms of single female poverty, the demographic groups most similar to Cheyenne are Pima (30.3%, a difference of 0.22%), Cajun (30.6%, a difference of 0.81%), Sioux (31.3%, a difference of 2.8%), Yuman (29.4%, a difference of 3.2%), and Navajo (31.7%, a difference of 4.1%).
| Demographics | Rating | Rank | Single Female Poverty |
| Yakama | 0.0 /100 | #332 | Tragic 28.3% |
| Ute | 0.0 /100 | #333 | Tragic 28.4% |
| Pueblo | 0.0 /100 | #334 | Tragic 28.6% |
| Immigrants | Yemen | 0.0 /100 | #335 | Tragic 28.9% |
| Colville | 0.0 /100 | #336 | Tragic 29.1% |
| Yuman | 0.0 /100 | #337 | Tragic 29.4% |
| Pima | 0.0 /100 | #338 | Tragic 30.3% |
| Cheyenne | 0.0 /100 | #339 | Tragic 30.4% |
| Cajuns | 0.0 /100 | #340 | Tragic 30.6% |
| Sioux | 0.0 /100 | #341 | Tragic 31.3% |
| Navajo | 0.0 /100 | #342 | Tragic 31.7% |
| Crow | 0.0 /100 | #343 | Tragic 32.4% |
| Lumbee | 0.0 /100 | #344 | Tragic 33.0% |
| Houma | 0.0 /100 | #345 | Tragic 33.8% |
| Puerto Ricans | 0.0 /100 | #346 | Tragic 34.1% |