Immigrants from Ecuador vs Choctaw Poverty
COMPARE
Immigrants from Ecuador
Choctaw
Poverty
Poverty Comparison
Immigrants from Ecuador
Choctaw
14.3%
POVERTY
0.1/ 100
METRIC RATING
255th/ 347
METRIC RANK
15.6%
POVERTY
0.0/ 100
METRIC RATING
308th/ 347
METRIC RANK
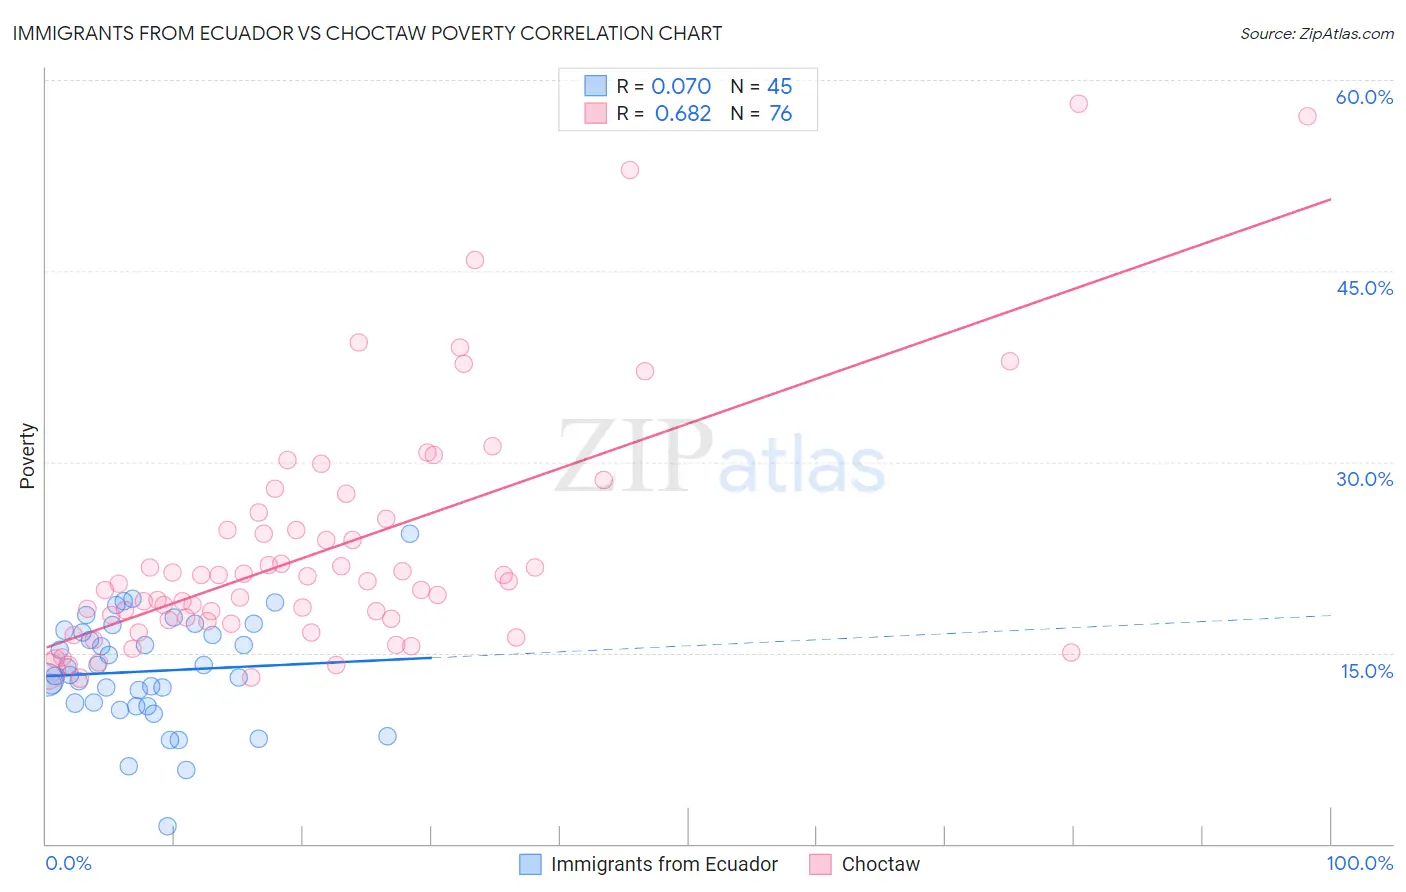
Immigrants from Ecuador vs Choctaw Poverty Correlation Chart
The statistical analysis conducted on geographies consisting of 270,887,290 people shows a slight positive correlation between the proportion of Immigrants from Ecuador and poverty level in the United States with a correlation coefficient (R) of 0.070 and weighted average of 14.3%. Similarly, the statistical analysis conducted on geographies consisting of 269,626,558 people shows a significant positive correlation between the proportion of Choctaw and poverty level in the United States with a correlation coefficient (R) of 0.682 and weighted average of 15.6%, a difference of 9.2%.
Poverty Correlation Summary
| Measurement | Immigrants from Ecuador | Choctaw |
| Minimum | 1.4% | 13.0% |
| Maximum | 24.4% | 58.1% |
| Range | 23.0% | 45.1% |
| Mean | 13.6% | 23.1% |
| Median | 13.3% | 20.5% |
| Interquartile 25% (IQ1) | 10.9% | 17.5% |
| Interquartile 75% (IQ3) | 16.7% | 25.1% |
| Interquartile Range (IQR) | 5.8% | 7.6% |
| Standard Deviation (Sample) | 4.3% | 9.6% |
| Standard Deviation (Population) | 4.2% | 9.6% |
Similar Demographics by Poverty
Demographics Similar to Immigrants from Ecuador by Poverty
In terms of poverty, the demographic groups most similar to Immigrants from Ecuador are Mexican American Indian (14.3%, a difference of 0.020%), Trinidadian and Tobagonian (14.3%, a difference of 0.060%), Ottawa (14.3%, a difference of 0.070%), Immigrants from El Salvador (14.3%, a difference of 0.10%), and Immigrants from Nicaragua (14.3%, a difference of 0.34%).
| Demographics | Rating | Rank | Poverty |
| Immigrants | Western Africa | 0.2 /100 | #248 | Tragic 14.1% |
| Immigrants | Ghana | 0.2 /100 | #249 | Tragic 14.2% |
| Cree | 0.2 /100 | #250 | Tragic 14.2% |
| Immigrants | Burma/Myanmar | 0.2 /100 | #251 | Tragic 14.2% |
| Spanish American Indians | 0.2 /100 | #252 | Tragic 14.2% |
| Immigrants | Trinidad and Tobago | 0.2 /100 | #253 | Tragic 14.2% |
| Immigrants | El Salvador | 0.1 /100 | #254 | Tragic 14.3% |
| Immigrants | Ecuador | 0.1 /100 | #255 | Tragic 14.3% |
| Mexican American Indians | 0.1 /100 | #256 | Tragic 14.3% |
| Trinidadians and Tobagonians | 0.1 /100 | #257 | Tragic 14.3% |
| Ottawa | 0.1 /100 | #258 | Tragic 14.3% |
| Immigrants | Nicaragua | 0.1 /100 | #259 | Tragic 14.3% |
| Cape Verdeans | 0.1 /100 | #260 | Tragic 14.4% |
| Cherokee | 0.1 /100 | #261 | Tragic 14.4% |
| Immigrants | Liberia | 0.1 /100 | #262 | Tragic 14.4% |
Demographics Similar to Choctaw by Poverty
In terms of poverty, the demographic groups most similar to Choctaw are Seminole (15.6%, a difference of 0.040%), African (15.6%, a difference of 0.11%), Dutch West Indian (15.6%, a difference of 0.13%), Creek (15.6%, a difference of 0.18%), and Chippewa (15.7%, a difference of 0.52%).
| Demographics | Rating | Rank | Poverty |
| Bahamians | 0.0 /100 | #301 | Tragic 15.4% |
| Somalis | 0.0 /100 | #302 | Tragic 15.4% |
| Immigrants | Caribbean | 0.0 /100 | #303 | Tragic 15.5% |
| Immigrants | Mexico | 0.0 /100 | #304 | Tragic 15.5% |
| Immigrants | Guatemala | 0.0 /100 | #305 | Tragic 15.5% |
| Creek | 0.0 /100 | #306 | Tragic 15.6% |
| Africans | 0.0 /100 | #307 | Tragic 15.6% |
| Choctaw | 0.0 /100 | #308 | Tragic 15.6% |
| Seminole | 0.0 /100 | #309 | Tragic 15.6% |
| Dutch West Indians | 0.0 /100 | #310 | Tragic 15.6% |
| Chippewa | 0.0 /100 | #311 | Tragic 15.7% |
| Cajuns | 0.0 /100 | #312 | Tragic 15.7% |
| Immigrants | Grenada | 0.0 /100 | #313 | Tragic 15.8% |
| Immigrants | Somalia | 0.0 /100 | #314 | Tragic 15.8% |
| British West Indians | 0.0 /100 | #315 | Tragic 15.9% |