Immigrants from Belize vs Choctaw Householder Income Ages 45 - 64 years
COMPARE
Immigrants from Belize
Choctaw
Householder Income Ages 45 - 64 years
Householder Income Ages 45 - 64 years Comparison
Immigrants from Belize
Choctaw
$87,229
HOUSEHOLDER INCOME AGES 45 - 64 YEARS
0.1/ 100
METRIC RATING
275th/ 347
METRIC RANK
$82,287
HOUSEHOLDER INCOME AGES 45 - 64 YEARS
0.0/ 100
METRIC RATING
318th/ 347
METRIC RANK
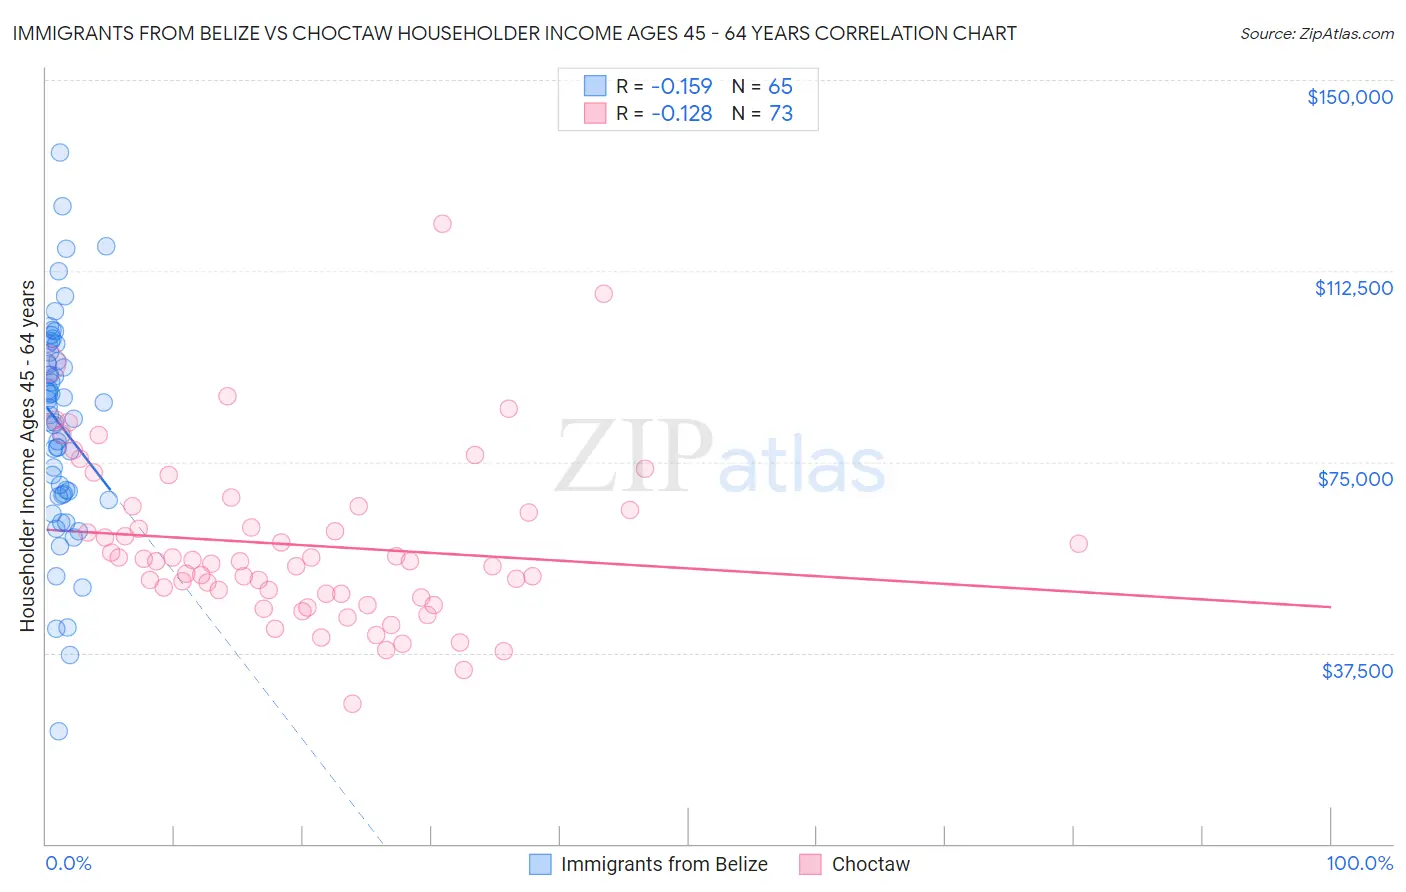
Immigrants from Belize vs Choctaw Householder Income Ages 45 - 64 years Correlation Chart
The statistical analysis conducted on geographies consisting of 130,242,241 people shows a poor negative correlation between the proportion of Immigrants from Belize and household income with householder between the ages 45 and 64 in the United States with a correlation coefficient (R) of -0.159 and weighted average of $87,229. Similarly, the statistical analysis conducted on geographies consisting of 269,212,167 people shows a poor negative correlation between the proportion of Choctaw and household income with householder between the ages 45 and 64 in the United States with a correlation coefficient (R) of -0.128 and weighted average of $82,287, a difference of 6.0%.
Householder Income Ages 45 - 64 years Correlation Summary
| Measurement | Immigrants from Belize | Choctaw |
| Minimum | $22,213 | $27,500 |
| Maximum | $135,848 | $121,667 |
| Range | $113,635 | $94,167 |
| Mean | $82,353 | $58,687 |
| Median | $84,313 | $55,469 |
| Interquartile 25% (IQ1) | $68,610 | $48,732 |
| Interquartile 75% (IQ3) | $95,695 | $65,840 |
| Interquartile Range (IQR) | $27,084 | $17,109 |
| Standard Deviation (Sample) | $20,996 | $16,580 |
| Standard Deviation (Population) | $20,834 | $16,466 |
Similar Demographics by Householder Income Ages 45 - 64 years
Demographics Similar to Immigrants from Belize by Householder Income Ages 45 - 64 years
In terms of householder income ages 45 - 64 years, the demographic groups most similar to Immigrants from Belize are Immigrants from Latin America ($87,219, a difference of 0.010%), Iroquois ($87,255, a difference of 0.030%), Cree ($87,185, a difference of 0.050%), Immigrants from Jamaica ($87,035, a difference of 0.22%), and Yakama ($86,992, a difference of 0.27%).
| Demographics | Rating | Rank | Householder Income Ages 45 - 64 years |
| Immigrants | Micronesia | 0.2 /100 | #268 | Tragic $87,864 |
| Spanish Americans | 0.2 /100 | #269 | Tragic $87,836 |
| Immigrants | Liberia | 0.2 /100 | #270 | Tragic $87,739 |
| Guatemalans | 0.2 /100 | #271 | Tragic $87,705 |
| Cape Verdeans | 0.2 /100 | #272 | Tragic $87,580 |
| Spanish American Indians | 0.2 /100 | #273 | Tragic $87,561 |
| Iroquois | 0.1 /100 | #274 | Tragic $87,255 |
| Immigrants | Belize | 0.1 /100 | #275 | Tragic $87,229 |
| Immigrants | Latin America | 0.1 /100 | #276 | Tragic $87,219 |
| Cree | 0.1 /100 | #277 | Tragic $87,185 |
| Immigrants | Jamaica | 0.1 /100 | #278 | Tragic $87,035 |
| Yakama | 0.1 /100 | #279 | Tragic $86,992 |
| Immigrants | Somalia | 0.1 /100 | #280 | Tragic $86,987 |
| Yaqui | 0.1 /100 | #281 | Tragic $86,914 |
| Senegalese | 0.1 /100 | #282 | Tragic $86,897 |
Demographics Similar to Choctaw by Householder Income Ages 45 - 64 years
In terms of householder income ages 45 - 64 years, the demographic groups most similar to Choctaw are Chickasaw ($82,193, a difference of 0.11%), Apache ($82,184, a difference of 0.13%), Yuman ($82,139, a difference of 0.18%), Colville ($82,474, a difference of 0.23%), and Immigrants from Caribbean ($82,513, a difference of 0.28%).
| Demographics | Rating | Rank | Householder Income Ages 45 - 64 years |
| Immigrants | Bahamas | 0.0 /100 | #311 | Tragic $83,177 |
| Cajuns | 0.0 /100 | #312 | Tragic $83,015 |
| U.S. Virgin Islanders | 0.0 /100 | #313 | Tragic $82,736 |
| Immigrants | Honduras | 0.0 /100 | #314 | Tragic $82,697 |
| Paiute | 0.0 /100 | #315 | Tragic $82,629 |
| Immigrants | Caribbean | 0.0 /100 | #316 | Tragic $82,513 |
| Colville | 0.0 /100 | #317 | Tragic $82,474 |
| Choctaw | 0.0 /100 | #318 | Tragic $82,287 |
| Chickasaw | 0.0 /100 | #319 | Tragic $82,193 |
| Apache | 0.0 /100 | #320 | Tragic $82,184 |
| Yuman | 0.0 /100 | #321 | Tragic $82,139 |
| Sioux | 0.0 /100 | #322 | Tragic $81,750 |
| Bahamians | 0.0 /100 | #323 | Tragic $81,369 |
| Yup'ik | 0.0 /100 | #324 | Tragic $81,000 |
| Immigrants | Cuba | 0.0 /100 | #325 | Tragic $80,662 |