Immigrants from Belgium vs Dutch West Indian In Labor Force | Age 30-34
COMPARE
Immigrants from Belgium
Dutch West Indian
In Labor Force | Age 30-34
In Labor Force | Age 30-34 Comparison
Immigrants from Belgium
Dutch West Indians
85.3%
IN LABOR FORCE | AGE 30-34
98.2/ 100
METRIC RATING
88th/ 347
METRIC RANK
81.0%
IN LABOR FORCE | AGE 30-34
0.0/ 100
METRIC RATING
325th/ 347
METRIC RANK
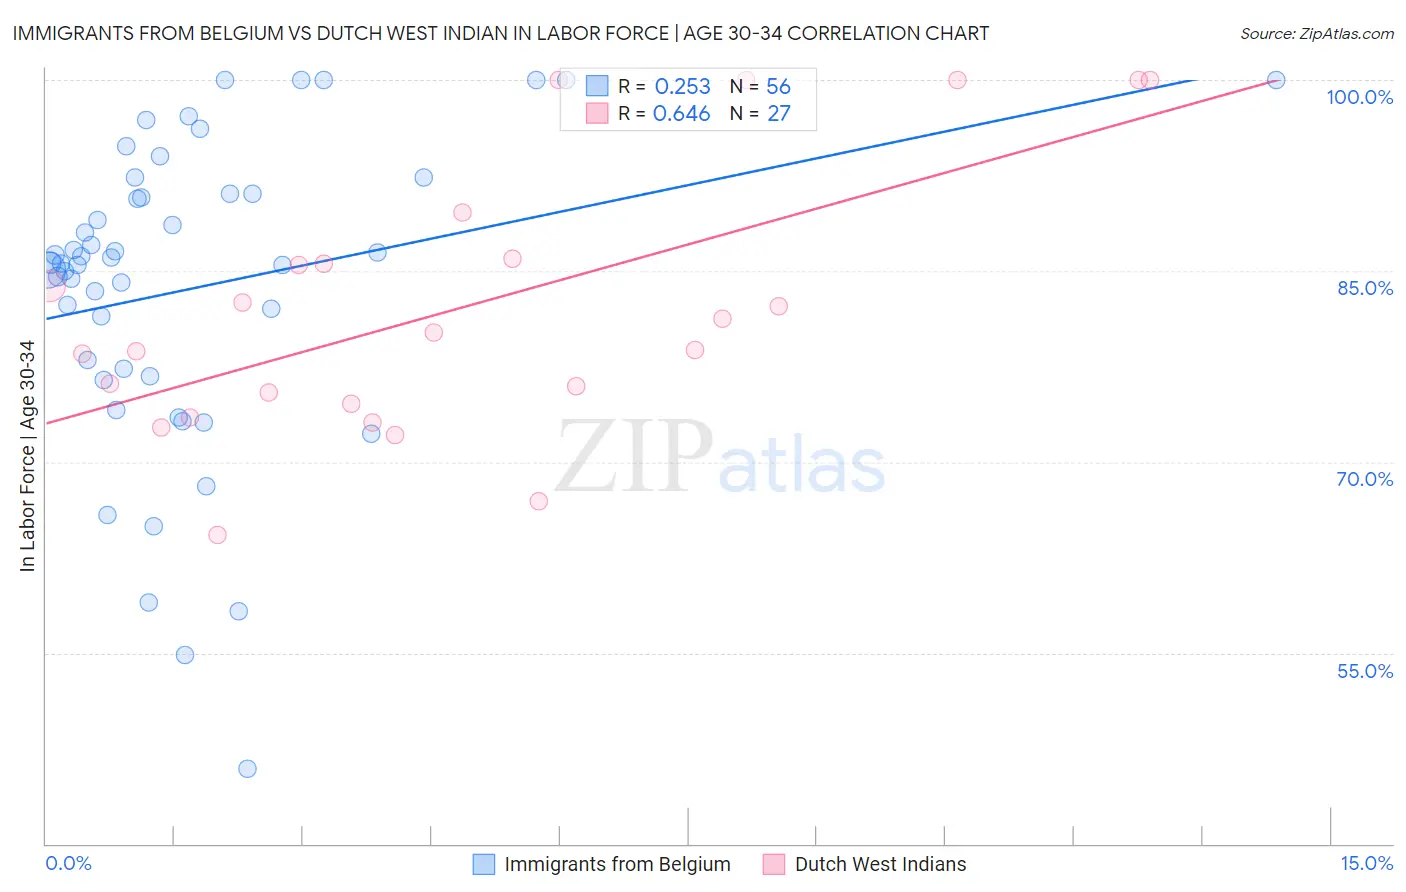
Immigrants from Belgium vs Dutch West Indian In Labor Force | Age 30-34 Correlation Chart
The statistical analysis conducted on geographies consisting of 146,692,103 people shows a weak positive correlation between the proportion of Immigrants from Belgium and labor force participation rate among population between the ages 30 and 34 in the United States with a correlation coefficient (R) of 0.253 and weighted average of 85.3%. Similarly, the statistical analysis conducted on geographies consisting of 85,757,980 people shows a significant positive correlation between the proportion of Dutch West Indians and labor force participation rate among population between the ages 30 and 34 in the United States with a correlation coefficient (R) of 0.646 and weighted average of 81.0%, a difference of 5.2%.
In Labor Force | Age 30-34 Correlation Summary
| Measurement | Immigrants from Belgium | Dutch West Indian |
| Minimum | 45.9% | 64.3% |
| Maximum | 100.0% | 100.0% |
| Range | 54.1% | 35.7% |
| Mean | 83.6% | 82.1% |
| Median | 85.6% | 80.2% |
| Interquartile 25% (IQ1) | 77.0% | 74.5% |
| Interquartile 75% (IQ3) | 91.1% | 86.0% |
| Interquartile Range (IQR) | 14.1% | 11.4% |
| Standard Deviation (Sample) | 12.1% | 10.4% |
| Standard Deviation (Population) | 12.0% | 10.2% |
Similar Demographics by In Labor Force | Age 30-34
Demographics Similar to Immigrants from Belgium by In Labor Force | Age 30-34
In terms of in labor force | age 30-34, the demographic groups most similar to Immigrants from Belgium are Immigrants from Taiwan (85.3%, a difference of 0.010%), Immigrants from Northern Europe (85.3%, a difference of 0.010%), Immigrants from Kazakhstan (85.3%, a difference of 0.010%), Burmese (85.3%, a difference of 0.020%), and Mongolian (85.3%, a difference of 0.030%).
| Demographics | Rating | Rank | In Labor Force | Age 30-34 |
| Slovaks | 98.7 /100 | #81 | Exceptional 85.3% |
| Immigrants | Africa | 98.6 /100 | #82 | Exceptional 85.3% |
| Immigrants | Europe | 98.6 /100 | #83 | Exceptional 85.3% |
| Greeks | 98.6 /100 | #84 | Exceptional 85.3% |
| Mongolians | 98.5 /100 | #85 | Exceptional 85.3% |
| Immigrants | Taiwan | 98.3 /100 | #86 | Exceptional 85.3% |
| Immigrants | Northern Europe | 98.2 /100 | #87 | Exceptional 85.3% |
| Immigrants | Belgium | 98.2 /100 | #88 | Exceptional 85.3% |
| Immigrants | Kazakhstan | 98.1 /100 | #89 | Exceptional 85.3% |
| Burmese | 97.9 /100 | #90 | Exceptional 85.3% |
| Immigrants | Moldova | 97.9 /100 | #91 | Exceptional 85.3% |
| German Russians | 97.7 /100 | #92 | Exceptional 85.2% |
| Immigrants | Norway | 97.6 /100 | #93 | Exceptional 85.2% |
| Swedes | 97.5 /100 | #94 | Exceptional 85.2% |
| Immigrants | India | 97.4 /100 | #95 | Exceptional 85.2% |
Demographics Similar to Dutch West Indians by In Labor Force | Age 30-34
In terms of in labor force | age 30-34, the demographic groups most similar to Dutch West Indians are Cheyenne (81.1%, a difference of 0.15%), Paiute (81.2%, a difference of 0.19%), Seminole (80.8%, a difference of 0.22%), Puerto Rican (81.2%, a difference of 0.23%), and Alaska Native (81.3%, a difference of 0.39%).
| Demographics | Rating | Rank | In Labor Force | Age 30-34 |
| Choctaw | 0.0 /100 | #318 | Tragic 81.4% |
| Shoshone | 0.0 /100 | #319 | Tragic 81.4% |
| Yaqui | 0.0 /100 | #320 | Tragic 81.4% |
| Alaska Natives | 0.0 /100 | #321 | Tragic 81.3% |
| Puerto Ricans | 0.0 /100 | #322 | Tragic 81.2% |
| Paiute | 0.0 /100 | #323 | Tragic 81.2% |
| Cheyenne | 0.0 /100 | #324 | Tragic 81.1% |
| Dutch West Indians | 0.0 /100 | #325 | Tragic 81.0% |
| Seminole | 0.0 /100 | #326 | Tragic 80.8% |
| Colville | 0.0 /100 | #327 | Tragic 80.7% |
| Sioux | 0.0 /100 | #328 | Tragic 80.4% |
| Creek | 0.0 /100 | #329 | Tragic 80.4% |
| Pueblo | 0.0 /100 | #330 | Tragic 80.0% |
| Houma | 0.0 /100 | #331 | Tragic 79.9% |
| Kiowa | 0.0 /100 | #332 | Tragic 79.8% |