Immigrants from Belarus vs Bolivian Single Mother Poverty
COMPARE
Immigrants from Belarus
Bolivian
Single Mother Poverty
Single Mother Poverty Comparison
Immigrants from Belarus
Bolivians
27.4%
SINGLE MOTHER POVERTY
99.4/ 100
METRIC RATING
70th/ 347
METRIC RANK
25.9%
SINGLE MOTHER POVERTY
100.0/ 100
METRIC RATING
16th/ 347
METRIC RANK
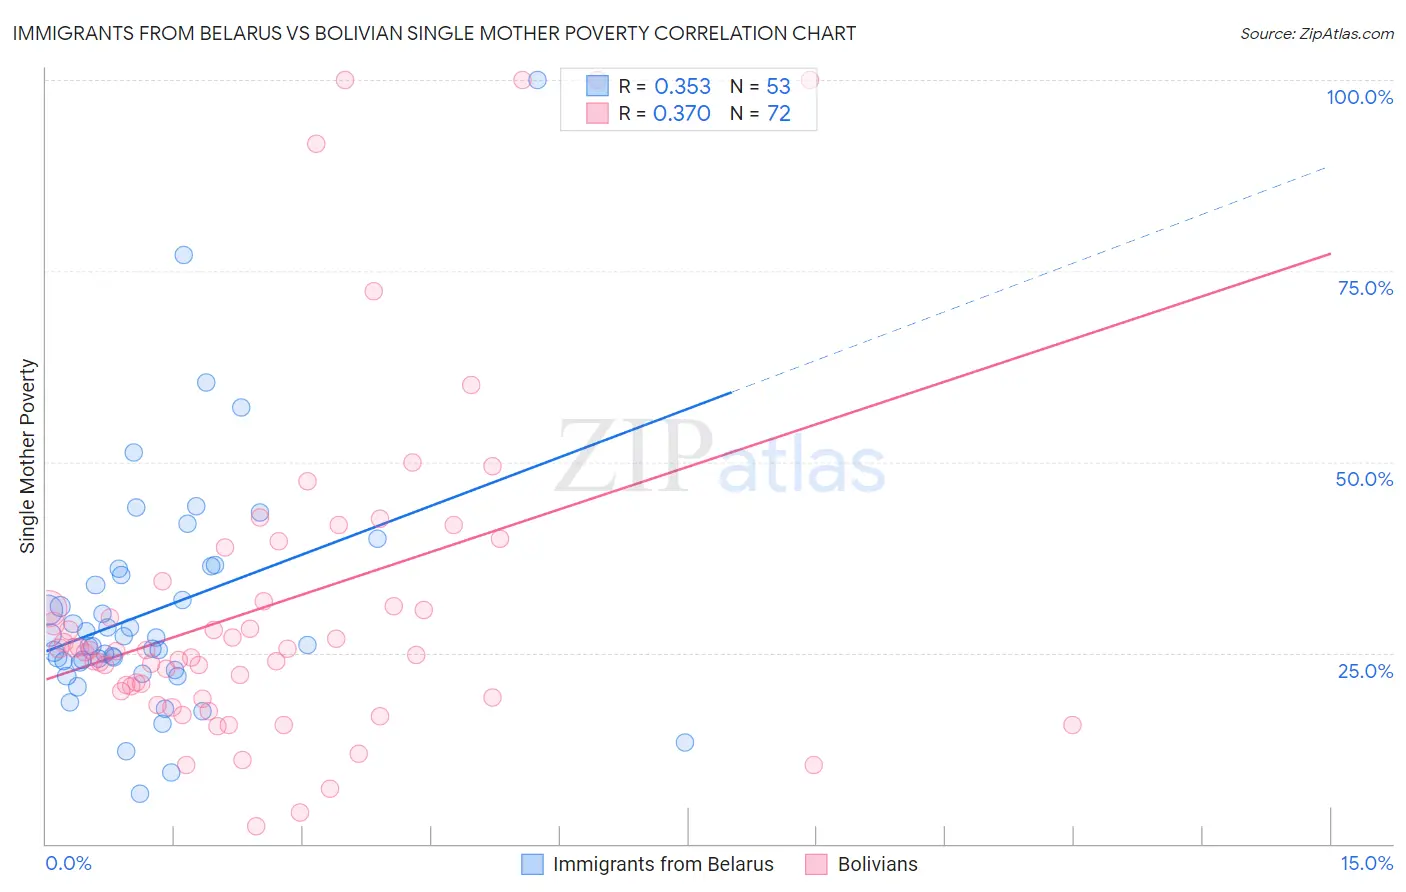
Immigrants from Belarus vs Bolivian Single Mother Poverty Correlation Chart
The statistical analysis conducted on geographies consisting of 148,206,459 people shows a mild positive correlation between the proportion of Immigrants from Belarus and poverty level among single mothers in the United States with a correlation coefficient (R) of 0.353 and weighted average of 27.4%. Similarly, the statistical analysis conducted on geographies consisting of 182,525,301 people shows a mild positive correlation between the proportion of Bolivians and poverty level among single mothers in the United States with a correlation coefficient (R) of 0.370 and weighted average of 25.9%, a difference of 5.7%.
Single Mother Poverty Correlation Summary
| Measurement | Immigrants from Belarus | Bolivian |
| Minimum | 6.6% | 2.2% |
| Maximum | 100.0% | 100.0% |
| Range | 93.4% | 97.8% |
| Mean | 30.6% | 31.3% |
| Median | 26.1% | 25.3% |
| Interquartile 25% (IQ1) | 23.2% | 19.6% |
| Interquartile 75% (IQ3) | 35.6% | 33.1% |
| Interquartile Range (IQR) | 12.4% | 13.5% |
| Standard Deviation (Sample) | 15.9% | 22.0% |
| Standard Deviation (Population) | 15.8% | 21.8% |
Similar Demographics by Single Mother Poverty
Demographics Similar to Immigrants from Belarus by Single Mother Poverty
In terms of single mother poverty, the demographic groups most similar to Immigrants from Belarus are Lithuanian (27.4%, a difference of 0.010%), Macedonian (27.4%, a difference of 0.020%), Immigrants from Russia (27.4%, a difference of 0.040%), Sierra Leonean (27.4%, a difference of 0.11%), and Immigrants from Czechoslovakia (27.4%, a difference of 0.17%).
| Demographics | Rating | Rank | Single Mother Poverty |
| Immigrants | Northern Europe | 99.5 /100 | #63 | Exceptional 27.3% |
| Russians | 99.5 /100 | #64 | Exceptional 27.3% |
| Immigrants | Turkey | 99.5 /100 | #65 | Exceptional 27.3% |
| Soviet Union | 99.5 /100 | #66 | Exceptional 27.3% |
| Immigrants | Australia | 99.5 /100 | #67 | Exceptional 27.3% |
| Immigrants | Czechoslovakia | 99.5 /100 | #68 | Exceptional 27.4% |
| Lithuanians | 99.4 /100 | #69 | Exceptional 27.4% |
| Immigrants | Belarus | 99.4 /100 | #70 | Exceptional 27.4% |
| Macedonians | 99.4 /100 | #71 | Exceptional 27.4% |
| Immigrants | Russia | 99.4 /100 | #72 | Exceptional 27.4% |
| Sierra Leoneans | 99.3 /100 | #73 | Exceptional 27.4% |
| Immigrants | Europe | 99.3 /100 | #74 | Exceptional 27.4% |
| Immigrants | Sweden | 99.2 /100 | #75 | Exceptional 27.5% |
| Peruvians | 99.2 /100 | #76 | Exceptional 27.5% |
| Immigrants | Peru | 99.2 /100 | #77 | Exceptional 27.5% |
Demographics Similar to Bolivians by Single Mother Poverty
In terms of single mother poverty, the demographic groups most similar to Bolivians are Asian (26.0%, a difference of 0.18%), Immigrants from Ireland (25.8%, a difference of 0.29%), Immigrants from Pakistan (26.0%, a difference of 0.46%), Immigrants from Singapore (25.8%, a difference of 0.47%), and Immigrants from Eastern Asia (26.1%, a difference of 0.61%).
| Demographics | Rating | Rank | Single Mother Poverty |
| Immigrants | Lithuania | 100.0 /100 | #9 | Exceptional 25.2% |
| Immigrants | South Central Asia | 100.0 /100 | #10 | Exceptional 25.3% |
| Iranians | 100.0 /100 | #11 | Exceptional 25.5% |
| Bhutanese | 100.0 /100 | #12 | Exceptional 25.6% |
| Indians (Asian) | 100.0 /100 | #13 | Exceptional 25.8% |
| Immigrants | Singapore | 100.0 /100 | #14 | Exceptional 25.8% |
| Immigrants | Ireland | 100.0 /100 | #15 | Exceptional 25.8% |
| Bolivians | 100.0 /100 | #16 | Exceptional 25.9% |
| Asians | 100.0 /100 | #17 | Exceptional 26.0% |
| Immigrants | Pakistan | 100.0 /100 | #18 | Exceptional 26.0% |
| Immigrants | Eastern Asia | 100.0 /100 | #19 | Exceptional 26.1% |
| Immigrants | China | 100.0 /100 | #20 | Exceptional 26.1% |
| Immigrants | Bolivia | 100.0 /100 | #21 | Exceptional 26.2% |
| Immigrants | Korea | 100.0 /100 | #22 | Exceptional 26.2% |
| Burmese | 100.0 /100 | #23 | Exceptional 26.2% |