Immigrants from Belarus vs Laotian Single Mother Poverty
COMPARE
Immigrants from Belarus
Laotian
Single Mother Poverty
Single Mother Poverty Comparison
Immigrants from Belarus
Laotians
27.4%
SINGLE MOTHER POVERTY
99.4/ 100
METRIC RATING
70th/ 347
METRIC RANK
27.0%
SINGLE MOTHER POVERTY
99.8/ 100
METRIC RATING
50th/ 347
METRIC RANK
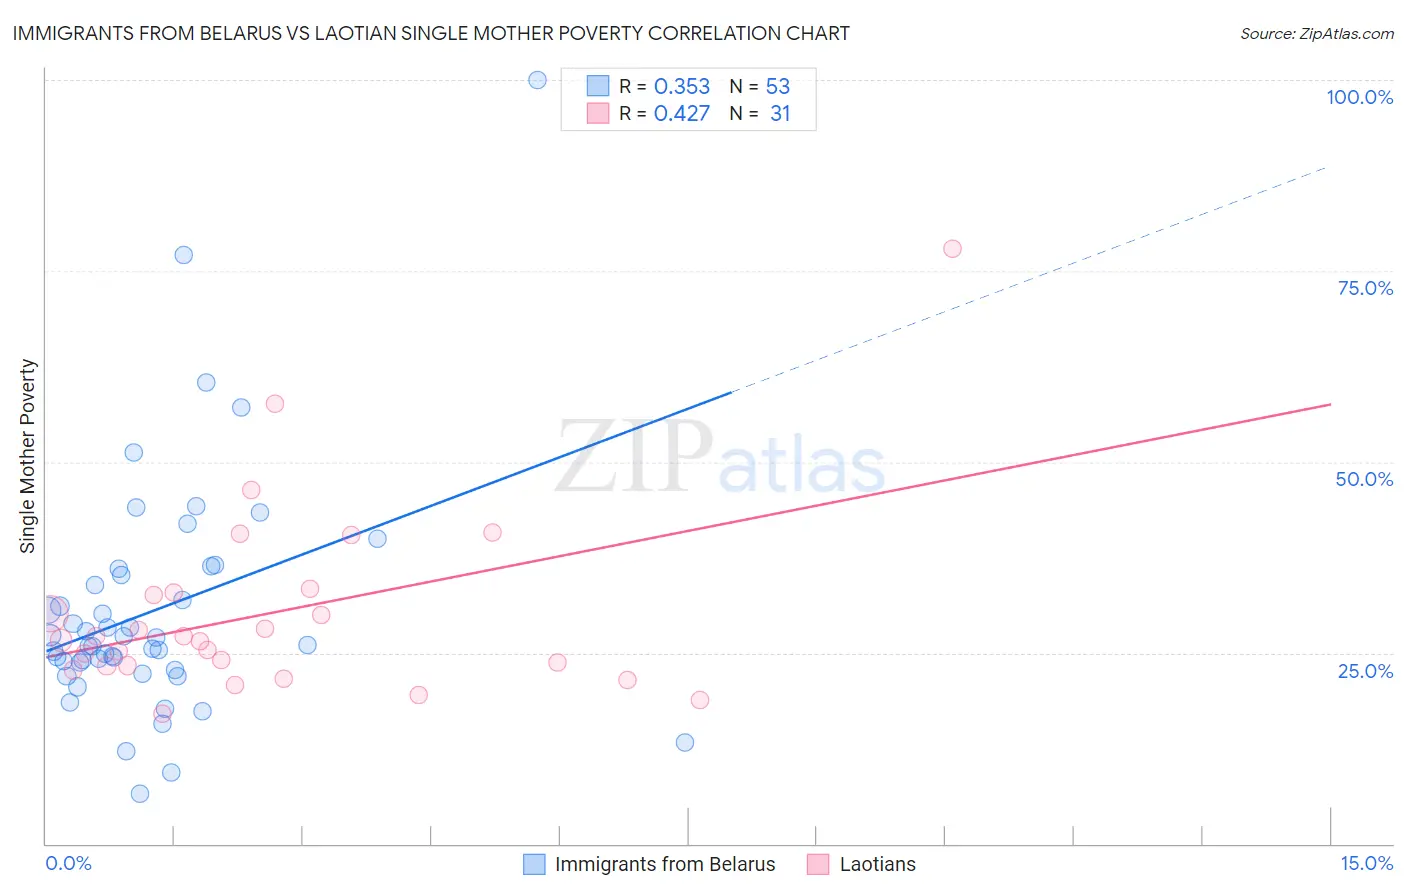
Immigrants from Belarus vs Laotian Single Mother Poverty Correlation Chart
The statistical analysis conducted on geographies consisting of 148,206,459 people shows a mild positive correlation between the proportion of Immigrants from Belarus and poverty level among single mothers in the United States with a correlation coefficient (R) of 0.353 and weighted average of 27.4%. Similarly, the statistical analysis conducted on geographies consisting of 221,717,898 people shows a moderate positive correlation between the proportion of Laotians and poverty level among single mothers in the United States with a correlation coefficient (R) of 0.427 and weighted average of 27.0%, a difference of 1.6%.
Single Mother Poverty Correlation Summary
| Measurement | Immigrants from Belarus | Laotian |
| Minimum | 6.6% | 17.0% |
| Maximum | 100.0% | 78.0% |
| Range | 93.4% | 60.9% |
| Mean | 30.6% | 30.2% |
| Median | 26.1% | 26.6% |
| Interquartile 25% (IQ1) | 23.2% | 23.3% |
| Interquartile 75% (IQ3) | 35.6% | 32.8% |
| Interquartile Range (IQR) | 12.4% | 9.6% |
| Standard Deviation (Sample) | 15.9% | 12.5% |
| Standard Deviation (Population) | 15.8% | 12.3% |
Demographics Similar to Immigrants from Belarus and Laotians by Single Mother Poverty
In terms of single mother poverty, the demographic groups most similar to Immigrants from Belarus are Lithuanian (27.4%, a difference of 0.010%), Immigrants from Czechoslovakia (27.4%, a difference of 0.17%), Immigrants from Australia (27.3%, a difference of 0.20%), Soviet Union (27.3%, a difference of 0.22%), and Immigrants from Turkey (27.3%, a difference of 0.26%). Similarly, the demographic groups most similar to Laotians are Immigrants from Argentina (27.1%, a difference of 0.55%), Immigrants from South Eastern Asia (27.1%, a difference of 0.59%), Immigrants from Jordan (27.1%, a difference of 0.63%), Immigrants from Bulgaria (27.1%, a difference of 0.66%), and Immigrants from Egypt (27.1%, a difference of 0.68%).
| Demographics | Rating | Rank | Single Mother Poverty |
| Laotians | 99.8 /100 | #50 | Exceptional 27.0% |
| Immigrants | Argentina | 99.7 /100 | #51 | Exceptional 27.1% |
| Immigrants | South Eastern Asia | 99.7 /100 | #52 | Exceptional 27.1% |
| Immigrants | Jordan | 99.7 /100 | #53 | Exceptional 27.1% |
| Immigrants | Bulgaria | 99.7 /100 | #54 | Exceptional 27.1% |
| Immigrants | Egypt | 99.7 /100 | #55 | Exceptional 27.1% |
| Immigrants | Romania | 99.7 /100 | #56 | Exceptional 27.2% |
| Palestinians | 99.7 /100 | #57 | Exceptional 27.2% |
| Argentineans | 99.6 /100 | #58 | Exceptional 27.2% |
| Paraguayans | 99.6 /100 | #59 | Exceptional 27.2% |
| Eastern Europeans | 99.6 /100 | #60 | Exceptional 27.2% |
| Immigrants | Eastern Europe | 99.6 /100 | #61 | Exceptional 27.2% |
| Immigrants | Malaysia | 99.5 /100 | #62 | Exceptional 27.3% |
| Immigrants | Northern Europe | 99.5 /100 | #63 | Exceptional 27.3% |
| Russians | 99.5 /100 | #64 | Exceptional 27.3% |
| Immigrants | Turkey | 99.5 /100 | #65 | Exceptional 27.3% |
| Soviet Union | 99.5 /100 | #66 | Exceptional 27.3% |
| Immigrants | Australia | 99.5 /100 | #67 | Exceptional 27.3% |
| Immigrants | Czechoslovakia | 99.5 /100 | #68 | Exceptional 27.4% |
| Lithuanians | 99.4 /100 | #69 | Exceptional 27.4% |
| Immigrants | Belarus | 99.4 /100 | #70 | Exceptional 27.4% |