Ecuadorian vs Bolivian Single Mother Poverty
COMPARE
Ecuadorian
Bolivian
Single Mother Poverty
Single Mother Poverty Comparison
Ecuadorians
Bolivians
30.8%
SINGLE MOTHER POVERTY
0.9/ 100
METRIC RATING
246th/ 347
METRIC RANK
25.9%
SINGLE MOTHER POVERTY
100.0/ 100
METRIC RATING
16th/ 347
METRIC RANK
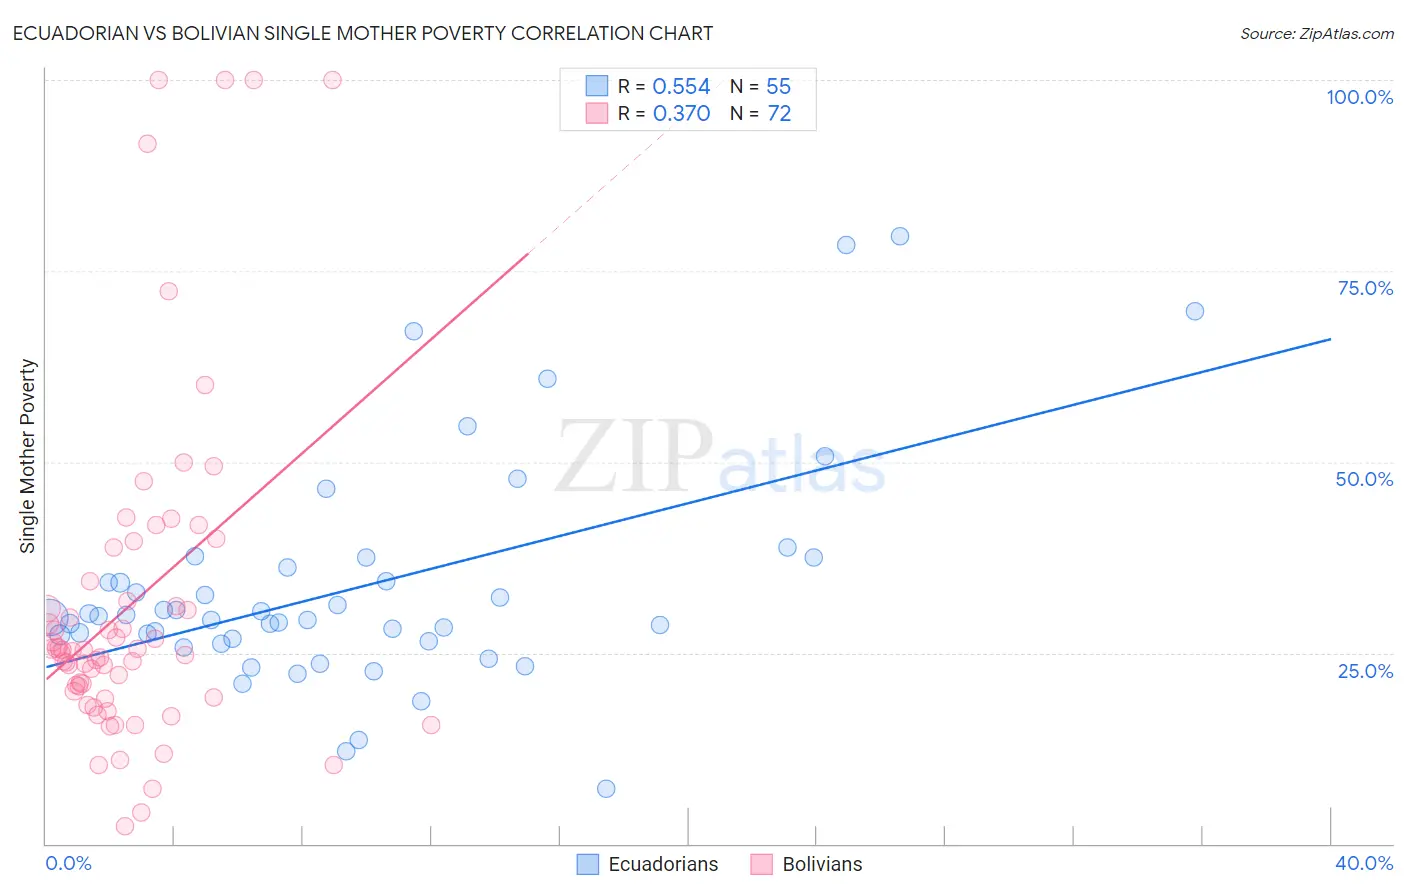
Ecuadorian vs Bolivian Single Mother Poverty Correlation Chart
The statistical analysis conducted on geographies consisting of 311,375,048 people shows a substantial positive correlation between the proportion of Ecuadorians and poverty level among single mothers in the United States with a correlation coefficient (R) of 0.554 and weighted average of 30.8%. Similarly, the statistical analysis conducted on geographies consisting of 182,525,301 people shows a mild positive correlation between the proportion of Bolivians and poverty level among single mothers in the United States with a correlation coefficient (R) of 0.370 and weighted average of 25.9%, a difference of 18.8%.
Single Mother Poverty Correlation Summary
| Measurement | Ecuadorian | Bolivian |
| Minimum | 7.3% | 2.2% |
| Maximum | 79.6% | 100.0% |
| Range | 72.3% | 97.8% |
| Mean | 33.5% | 31.3% |
| Median | 29.6% | 25.3% |
| Interquartile 25% (IQ1) | 26.5% | 19.6% |
| Interquartile 75% (IQ3) | 36.2% | 33.1% |
| Interquartile Range (IQR) | 9.8% | 13.5% |
| Standard Deviation (Sample) | 14.7% | 22.0% |
| Standard Deviation (Population) | 14.6% | 21.8% |
Similar Demographics by Single Mother Poverty
Demographics Similar to Ecuadorians by Single Mother Poverty
In terms of single mother poverty, the demographic groups most similar to Ecuadorians are West Indian (30.8%, a difference of 0.040%), French Canadian (30.8%, a difference of 0.080%), Cape Verdean (30.8%, a difference of 0.15%), Vietnamese (30.9%, a difference of 0.30%), and Barbadian (30.7%, a difference of 0.40%).
| Demographics | Rating | Rank | Single Mother Poverty |
| Immigrants | Portugal | 2.1 /100 | #239 | Tragic 30.5% |
| Salvadorans | 1.8 /100 | #240 | Tragic 30.6% |
| Immigrants | Laos | 1.8 /100 | #241 | Tragic 30.6% |
| Immigrants | Burma/Myanmar | 1.7 /100 | #242 | Tragic 30.6% |
| Bermudans | 1.6 /100 | #243 | Tragic 30.6% |
| French | 1.3 /100 | #244 | Tragic 30.7% |
| Barbadians | 1.3 /100 | #245 | Tragic 30.7% |
| Ecuadorians | 0.9 /100 | #246 | Tragic 30.8% |
| West Indians | 0.9 /100 | #247 | Tragic 30.8% |
| French Canadians | 0.9 /100 | #248 | Tragic 30.8% |
| Cape Verdeans | 0.8 /100 | #249 | Tragic 30.8% |
| Vietnamese | 0.7 /100 | #250 | Tragic 30.9% |
| Tlingit-Haida | 0.6 /100 | #251 | Tragic 30.9% |
| Alaska Natives | 0.6 /100 | #252 | Tragic 30.9% |
| Celtics | 0.6 /100 | #253 | Tragic 30.9% |
Demographics Similar to Bolivians by Single Mother Poverty
In terms of single mother poverty, the demographic groups most similar to Bolivians are Asian (26.0%, a difference of 0.18%), Immigrants from Ireland (25.8%, a difference of 0.29%), Immigrants from Pakistan (26.0%, a difference of 0.46%), Immigrants from Singapore (25.8%, a difference of 0.47%), and Immigrants from Eastern Asia (26.1%, a difference of 0.61%).
| Demographics | Rating | Rank | Single Mother Poverty |
| Immigrants | Lithuania | 100.0 /100 | #9 | Exceptional 25.2% |
| Immigrants | South Central Asia | 100.0 /100 | #10 | Exceptional 25.3% |
| Iranians | 100.0 /100 | #11 | Exceptional 25.5% |
| Bhutanese | 100.0 /100 | #12 | Exceptional 25.6% |
| Indians (Asian) | 100.0 /100 | #13 | Exceptional 25.8% |
| Immigrants | Singapore | 100.0 /100 | #14 | Exceptional 25.8% |
| Immigrants | Ireland | 100.0 /100 | #15 | Exceptional 25.8% |
| Bolivians | 100.0 /100 | #16 | Exceptional 25.9% |
| Asians | 100.0 /100 | #17 | Exceptional 26.0% |
| Immigrants | Pakistan | 100.0 /100 | #18 | Exceptional 26.0% |
| Immigrants | Eastern Asia | 100.0 /100 | #19 | Exceptional 26.1% |
| Immigrants | China | 100.0 /100 | #20 | Exceptional 26.1% |
| Immigrants | Bolivia | 100.0 /100 | #21 | Exceptional 26.2% |
| Immigrants | Korea | 100.0 /100 | #22 | Exceptional 26.2% |
| Burmese | 100.0 /100 | #23 | Exceptional 26.2% |