Fijian vs Bolivian Single Mother Poverty
COMPARE
Fijian
Bolivian
Single Mother Poverty
Single Mother Poverty Comparison
Fijians
Bolivians
31.6%
SINGLE MOTHER POVERTY
0.1/ 100
METRIC RATING
273rd/ 347
METRIC RANK
25.9%
SINGLE MOTHER POVERTY
100.0/ 100
METRIC RATING
16th/ 347
METRIC RANK
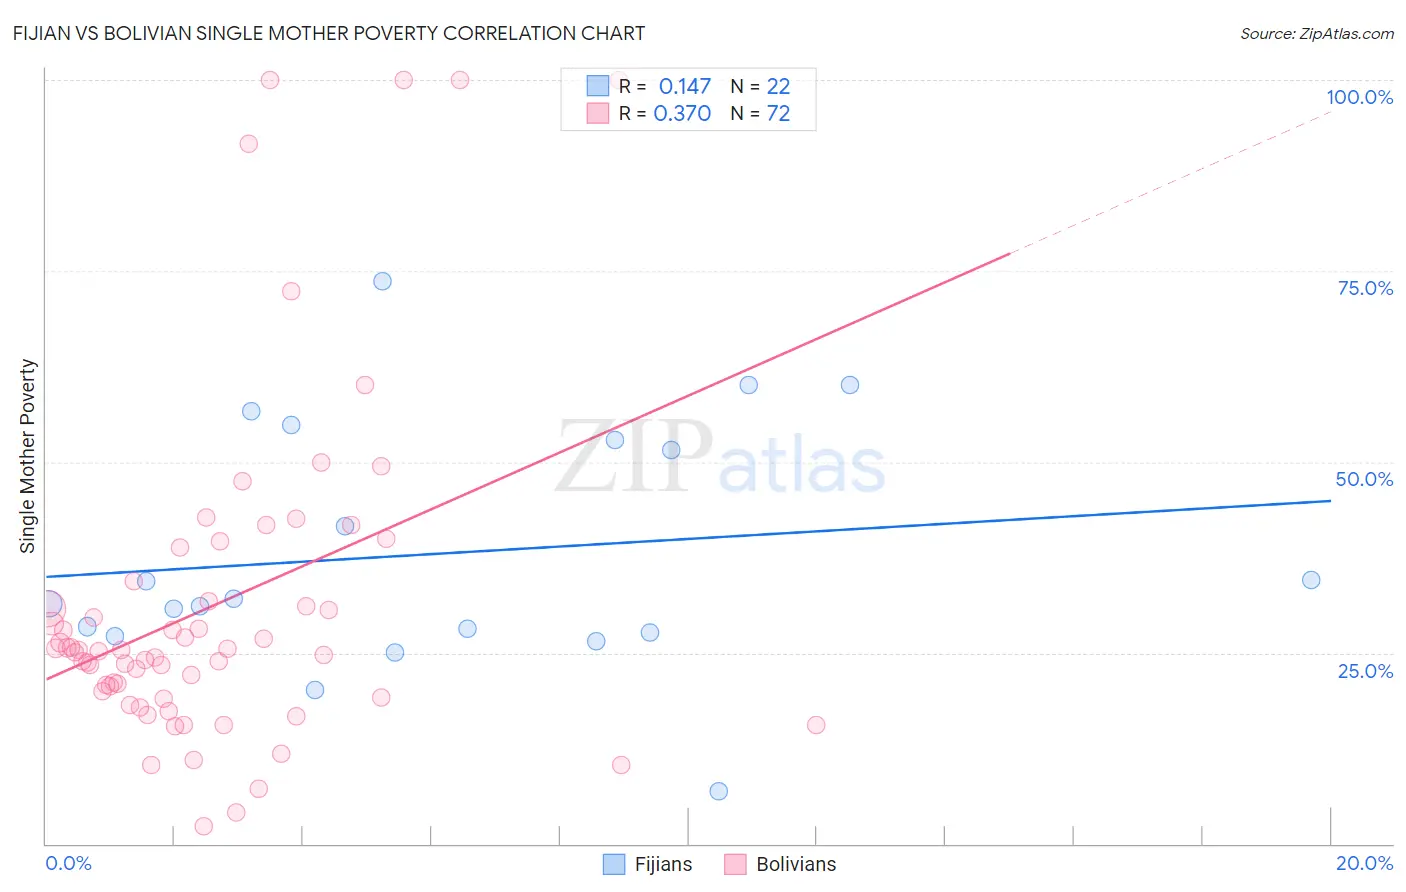
Fijian vs Bolivian Single Mother Poverty Correlation Chart
The statistical analysis conducted on geographies consisting of 55,870,068 people shows a poor positive correlation between the proportion of Fijians and poverty level among single mothers in the United States with a correlation coefficient (R) of 0.147 and weighted average of 31.6%. Similarly, the statistical analysis conducted on geographies consisting of 182,525,301 people shows a mild positive correlation between the proportion of Bolivians and poverty level among single mothers in the United States with a correlation coefficient (R) of 0.370 and weighted average of 25.9%, a difference of 22.1%.
Single Mother Poverty Correlation Summary
| Measurement | Fijian | Bolivian |
| Minimum | 6.9% | 2.2% |
| Maximum | 73.6% | 100.0% |
| Range | 66.7% | 97.8% |
| Mean | 38.0% | 31.3% |
| Median | 31.8% | 25.3% |
| Interquartile 25% (IQ1) | 27.7% | 19.6% |
| Interquartile 75% (IQ3) | 52.9% | 33.1% |
| Interquartile Range (IQR) | 25.1% | 13.5% |
| Standard Deviation (Sample) | 16.2% | 22.0% |
| Standard Deviation (Population) | 15.8% | 21.8% |
Similar Demographics by Single Mother Poverty
Demographics Similar to Fijians by Single Mother Poverty
In terms of single mother poverty, the demographic groups most similar to Fijians are Immigrants from Micronesia (31.6%, a difference of 0.23%), Bangladeshi (31.7%, a difference of 0.23%), Immigrants from Cabo Verde (31.6%, a difference of 0.25%), Central American (31.8%, a difference of 0.42%), and British West Indian (31.5%, a difference of 0.49%).
| Demographics | Rating | Rank | Single Mother Poverty |
| Sub-Saharan Africans | 0.2 /100 | #266 | Tragic 31.4% |
| Immigrants | Belize | 0.2 /100 | #267 | Tragic 31.4% |
| Immigrants | Senegal | 0.1 /100 | #268 | Tragic 31.5% |
| Scotch-Irish | 0.1 /100 | #269 | Tragic 31.5% |
| British West Indians | 0.1 /100 | #270 | Tragic 31.5% |
| Immigrants | Cabo Verde | 0.1 /100 | #271 | Tragic 31.6% |
| Immigrants | Micronesia | 0.1 /100 | #272 | Tragic 31.6% |
| Fijians | 0.1 /100 | #273 | Tragic 31.6% |
| Bangladeshis | 0.1 /100 | #274 | Tragic 31.7% |
| Central Americans | 0.1 /100 | #275 | Tragic 31.8% |
| Delaware | 0.0 /100 | #276 | Tragic 31.8% |
| Mexican American Indians | 0.0 /100 | #277 | Tragic 31.9% |
| Immigrants | Zaire | 0.0 /100 | #278 | Tragic 32.0% |
| Marshallese | 0.0 /100 | #279 | Tragic 32.1% |
| Immigrants | Nonimmigrants | 0.0 /100 | #280 | Tragic 32.2% |
Demographics Similar to Bolivians by Single Mother Poverty
In terms of single mother poverty, the demographic groups most similar to Bolivians are Asian (26.0%, a difference of 0.18%), Immigrants from Ireland (25.8%, a difference of 0.29%), Immigrants from Pakistan (26.0%, a difference of 0.46%), Immigrants from Singapore (25.8%, a difference of 0.47%), and Immigrants from Eastern Asia (26.1%, a difference of 0.61%).
| Demographics | Rating | Rank | Single Mother Poverty |
| Immigrants | Lithuania | 100.0 /100 | #9 | Exceptional 25.2% |
| Immigrants | South Central Asia | 100.0 /100 | #10 | Exceptional 25.3% |
| Iranians | 100.0 /100 | #11 | Exceptional 25.5% |
| Bhutanese | 100.0 /100 | #12 | Exceptional 25.6% |
| Indians (Asian) | 100.0 /100 | #13 | Exceptional 25.8% |
| Immigrants | Singapore | 100.0 /100 | #14 | Exceptional 25.8% |
| Immigrants | Ireland | 100.0 /100 | #15 | Exceptional 25.8% |
| Bolivians | 100.0 /100 | #16 | Exceptional 25.9% |
| Asians | 100.0 /100 | #17 | Exceptional 26.0% |
| Immigrants | Pakistan | 100.0 /100 | #18 | Exceptional 26.0% |
| Immigrants | Eastern Asia | 100.0 /100 | #19 | Exceptional 26.1% |
| Immigrants | China | 100.0 /100 | #20 | Exceptional 26.1% |
| Immigrants | Bolivia | 100.0 /100 | #21 | Exceptional 26.2% |
| Immigrants | Korea | 100.0 /100 | #22 | Exceptional 26.2% |
| Burmese | 100.0 /100 | #23 | Exceptional 26.2% |