Immigrants from Belarus vs Bolivian In Labor Force | Age 16-19
COMPARE
Immigrants from Belarus
Bolivian
In Labor Force | Age 16-19
In Labor Force | Age 16-19 Comparison
Immigrants from Belarus
Bolivians
33.4%
IN LABOR FORCE | AGE 16-19
0.1/ 100
METRIC RATING
291st/ 347
METRIC RANK
36.0%
IN LABOR FORCE | AGE 16-19
23.3/ 100
METRIC RATING
195th/ 347
METRIC RANK
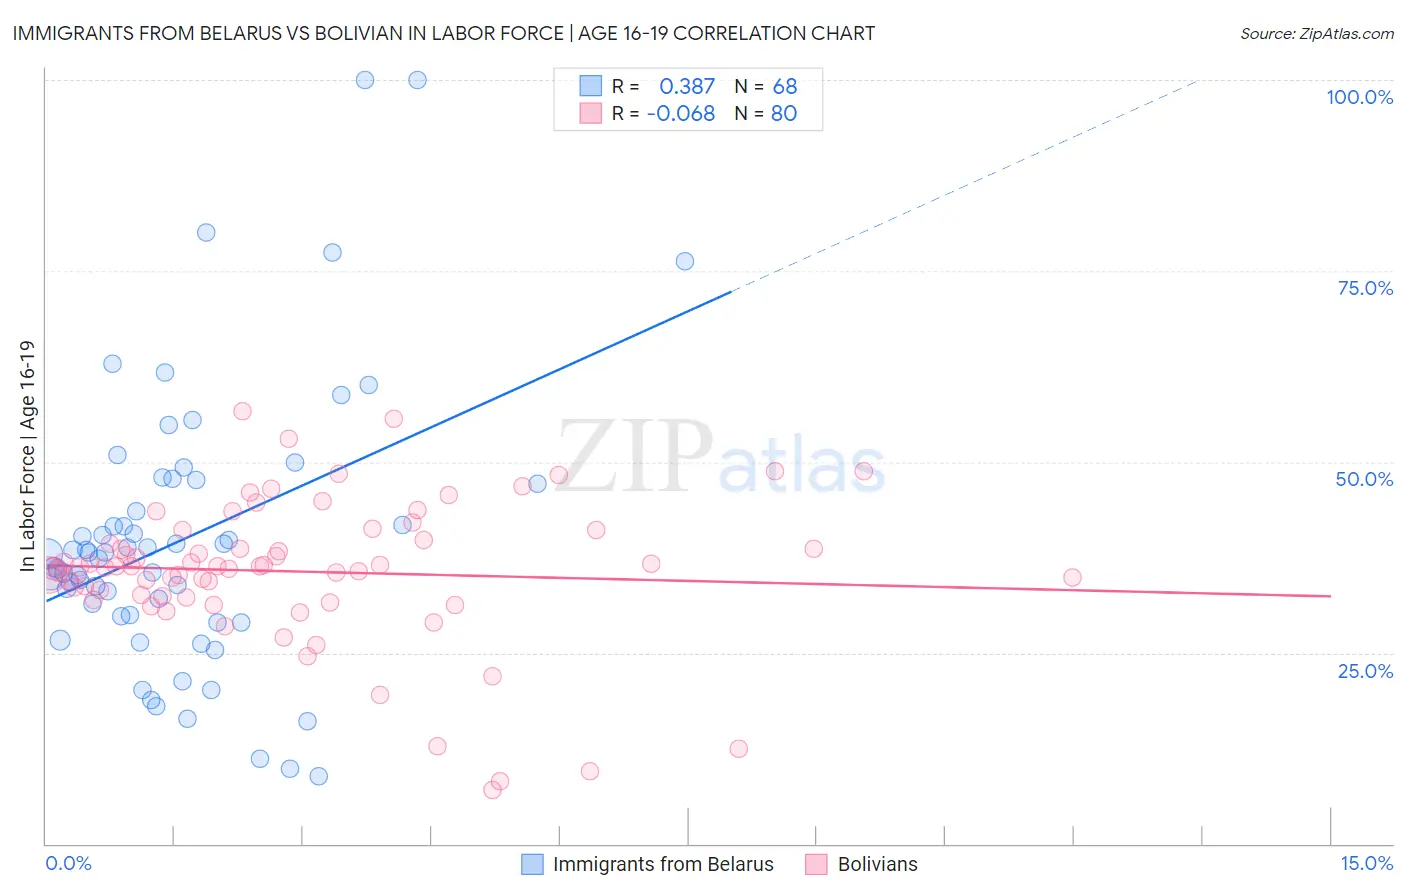
Immigrants from Belarus vs Bolivian In Labor Force | Age 16-19 Correlation Chart
The statistical analysis conducted on geographies consisting of 150,086,766 people shows a mild positive correlation between the proportion of Immigrants from Belarus and labor force participation rate among population between the ages 16 and 19 in the United States with a correlation coefficient (R) of 0.387 and weighted average of 33.4%. Similarly, the statistical analysis conducted on geographies consisting of 184,559,639 people shows a slight negative correlation between the proportion of Bolivians and labor force participation rate among population between the ages 16 and 19 in the United States with a correlation coefficient (R) of -0.068 and weighted average of 36.0%, a difference of 7.8%.
In Labor Force | Age 16-19 Correlation Summary
| Measurement | Immigrants from Belarus | Bolivian |
| Minimum | 8.8% | 7.1% |
| Maximum | 100.0% | 56.7% |
| Range | 91.2% | 49.6% |
| Mean | 39.8% | 35.6% |
| Median | 38.0% | 36.3% |
| Interquartile 25% (IQ1) | 29.9% | 32.3% |
| Interquartile 75% (IQ3) | 47.4% | 40.4% |
| Interquartile Range (IQR) | 17.5% | 8.1% |
| Standard Deviation (Sample) | 18.1% | 9.5% |
| Standard Deviation (Population) | 17.9% | 9.5% |
Similar Demographics by In Labor Force | Age 16-19
Demographics Similar to Immigrants from Belarus by In Labor Force | Age 16-19
In terms of in labor force | age 16-19, the demographic groups most similar to Immigrants from Belarus are Haitian (33.4%, a difference of 0.060%), Immigrants from Colombia (33.5%, a difference of 0.080%), Immigrants from Singapore (33.5%, a difference of 0.21%), Immigrants from Indonesia (33.5%, a difference of 0.22%), and Nepalese (33.5%, a difference of 0.25%).
| Demographics | Rating | Rank | In Labor Force | Age 16-19 |
| Immigrants | Spain | 0.2 /100 | #284 | Tragic 33.7% |
| U.S. Virgin Islanders | 0.2 /100 | #285 | Tragic 33.6% |
| South Americans | 0.2 /100 | #286 | Tragic 33.6% |
| Nepalese | 0.1 /100 | #287 | Tragic 33.5% |
| Immigrants | Indonesia | 0.1 /100 | #288 | Tragic 33.5% |
| Immigrants | Singapore | 0.1 /100 | #289 | Tragic 33.5% |
| Immigrants | Colombia | 0.1 /100 | #290 | Tragic 33.5% |
| Immigrants | Belarus | 0.1 /100 | #291 | Tragic 33.4% |
| Haitians | 0.1 /100 | #292 | Tragic 33.4% |
| Immigrants | South America | 0.1 /100 | #293 | Tragic 33.3% |
| Argentineans | 0.1 /100 | #294 | Tragic 33.3% |
| Yup'ik | 0.1 /100 | #295 | Tragic 33.3% |
| Jamaicans | 0.1 /100 | #296 | Tragic 33.2% |
| Immigrants | Haiti | 0.1 /100 | #297 | Tragic 33.2% |
| Iranians | 0.0 /100 | #298 | Tragic 33.0% |
Demographics Similar to Bolivians by In Labor Force | Age 16-19
In terms of in labor force | age 16-19, the demographic groups most similar to Bolivians are Nigerian (36.1%, a difference of 0.090%), Immigrants from Denmark (36.1%, a difference of 0.12%), Afghan (36.1%, a difference of 0.16%), Mexican American Indian (36.0%, a difference of 0.16%), and Immigrants from Serbia (36.0%, a difference of 0.17%).
| Demographics | Rating | Rank | In Labor Force | Age 16-19 |
| Immigrants | Europe | 31.8 /100 | #188 | Fair 36.2% |
| Immigrants | Hungary | 28.8 /100 | #189 | Fair 36.2% |
| Panamanians | 28.6 /100 | #190 | Fair 36.1% |
| Immigrants | Croatia | 27.5 /100 | #191 | Fair 36.1% |
| Afghans | 25.7 /100 | #192 | Fair 36.1% |
| Immigrants | Denmark | 25.0 /100 | #193 | Fair 36.1% |
| Nigerians | 24.6 /100 | #194 | Fair 36.1% |
| Bolivians | 23.3 /100 | #195 | Fair 36.0% |
| Mexican American Indians | 21.1 /100 | #196 | Fair 36.0% |
| Immigrants | Serbia | 21.0 /100 | #197 | Fair 36.0% |
| Immigrants | Northern Africa | 19.9 /100 | #198 | Poor 35.9% |
| Immigrants | Norway | 19.8 /100 | #199 | Poor 35.9% |
| Immigrants | Sweden | 18.8 /100 | #200 | Poor 35.9% |
| Alsatians | 17.5 /100 | #201 | Poor 35.9% |
| Senegalese | 17.4 /100 | #202 | Poor 35.9% |