Immigrants from Bangladesh vs Italian Single Female Poverty
COMPARE
Immigrants from Bangladesh
Italian
Single Female Poverty
Single Female Poverty Comparison
Immigrants from Bangladesh
Italians
22.3%
SINGLE FEMALE POVERTY
1.8/ 100
METRIC RATING
245th/ 347
METRIC RANK
19.6%
SINGLE FEMALE POVERTY
98.8/ 100
METRIC RATING
92nd/ 347
METRIC RANK
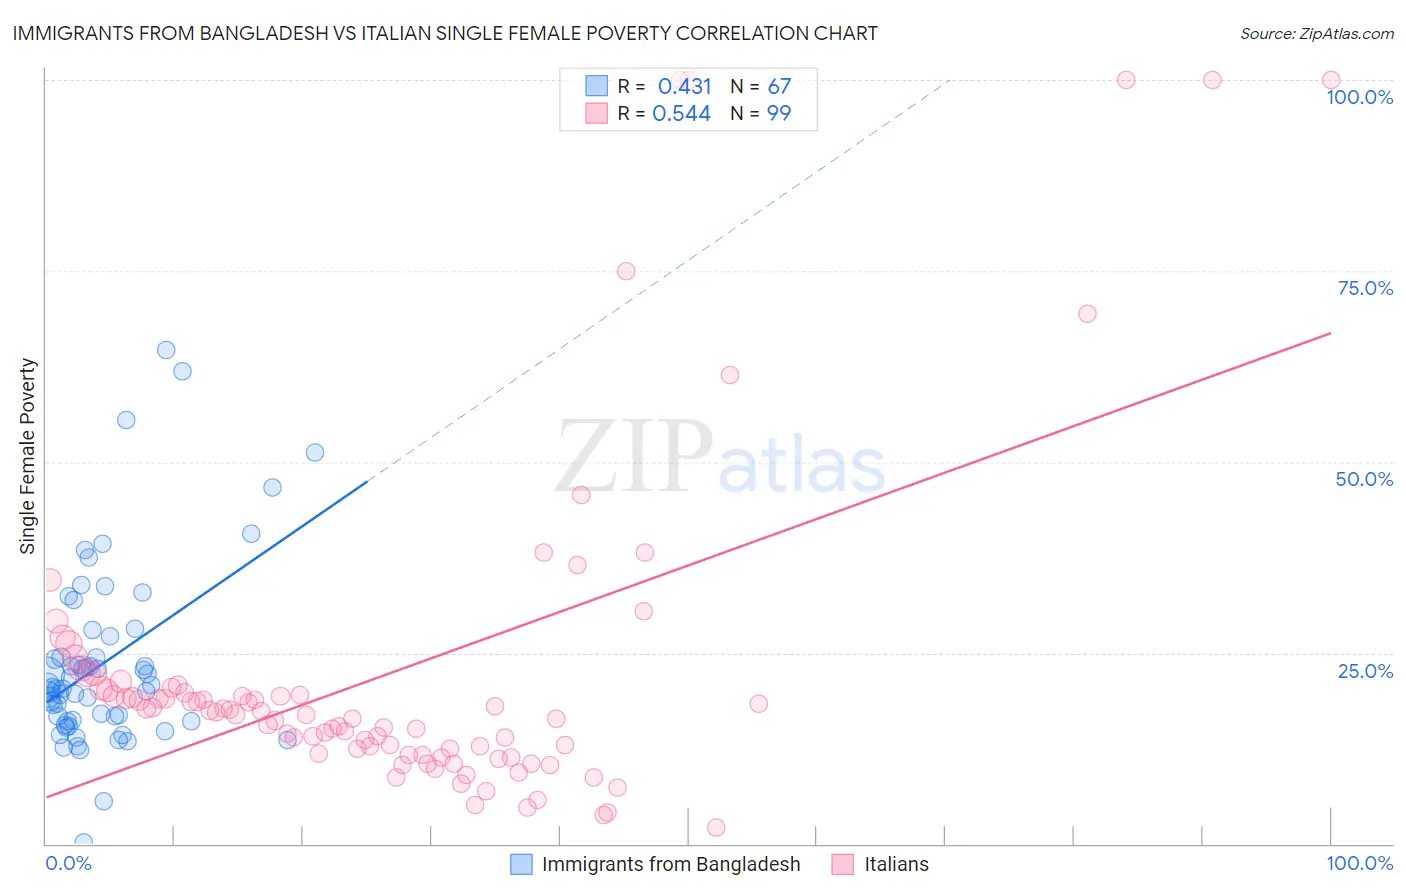
Immigrants from Bangladesh vs Italian Single Female Poverty Correlation Chart
The statistical analysis conducted on geographies consisting of 202,196,728 people shows a moderate positive correlation between the proportion of Immigrants from Bangladesh and poverty level among single females in the United States with a correlation coefficient (R) of 0.431 and weighted average of 22.3%. Similarly, the statistical analysis conducted on geographies consisting of 553,969,430 people shows a substantial positive correlation between the proportion of Italians and poverty level among single females in the United States with a correlation coefficient (R) of 0.544 and weighted average of 19.6%, a difference of 14.0%.
Single Female Poverty Correlation Summary
| Measurement | Immigrants from Bangladesh | Italian |
| Minimum | 0.22% | 2.0% |
| Maximum | 64.6% | 100.0% |
| Range | 64.4% | 98.0% |
| Mean | 23.7% | 22.4% |
| Median | 20.5% | 17.3% |
| Interquartile 25% (IQ1) | 16.1% | 11.8% |
| Interquartile 75% (IQ3) | 27.2% | 20.4% |
| Interquartile Range (IQR) | 11.1% | 8.6% |
| Standard Deviation (Sample) | 12.1% | 21.4% |
| Standard Deviation (Population) | 12.0% | 21.3% |
Similar Demographics by Single Female Poverty
Demographics Similar to Immigrants from Bangladesh by Single Female Poverty
In terms of single female poverty, the demographic groups most similar to Immigrants from Bangladesh are Immigrants from Middle Africa (22.3%, a difference of 0.040%), West Indian (22.3%, a difference of 0.050%), Bermudan (22.3%, a difference of 0.14%), Cape Verdean (22.3%, a difference of 0.21%), and French (22.2%, a difference of 0.35%).
| Demographics | Rating | Rank | Single Female Poverty |
| French Canadians | 2.8 /100 | #238 | Tragic 22.2% |
| Malaysians | 2.8 /100 | #239 | Tragic 22.2% |
| French | 2.3 /100 | #240 | Tragic 22.2% |
| Cape Verdeans | 2.1 /100 | #241 | Tragic 22.3% |
| Bermudans | 2.0 /100 | #242 | Tragic 22.3% |
| West Indians | 1.9 /100 | #243 | Tragic 22.3% |
| Immigrants | Middle Africa | 1.9 /100 | #244 | Tragic 22.3% |
| Immigrants | Bangladesh | 1.8 /100 | #245 | Tragic 22.3% |
| Liberians | 1.4 /100 | #246 | Tragic 22.4% |
| Immigrants | El Salvador | 1.4 /100 | #247 | Tragic 22.4% |
| Belizeans | 1.4 /100 | #248 | Tragic 22.4% |
| Immigrants | Caribbean | 1.3 /100 | #249 | Tragic 22.4% |
| Immigrants | Bahamas | 1.2 /100 | #250 | Tragic 22.5% |
| Immigrants | West Indies | 1.0 /100 | #251 | Tragic 22.5% |
| Delaware | 1.0 /100 | #252 | Tragic 22.5% |
Demographics Similar to Italians by Single Female Poverty
In terms of single female poverty, the demographic groups most similar to Italians are Immigrants from Austria (19.6%, a difference of 0.010%), Soviet Union (19.6%, a difference of 0.050%), Immigrants from Lebanon (19.6%, a difference of 0.11%), Romanian (19.6%, a difference of 0.23%), and Immigrants from Ukraine (19.5%, a difference of 0.29%).
| Demographics | Rating | Rank | Single Female Poverty |
| Immigrants | Albania | 99.2 /100 | #85 | Exceptional 19.4% |
| Greeks | 99.2 /100 | #86 | Exceptional 19.4% |
| Zimbabweans | 99.0 /100 | #87 | Exceptional 19.5% |
| Afghans | 99.0 /100 | #88 | Exceptional 19.5% |
| Immigrants | Ukraine | 99.0 /100 | #89 | Exceptional 19.5% |
| Immigrants | Lebanon | 98.8 /100 | #90 | Exceptional 19.6% |
| Soviet Union | 98.8 /100 | #91 | Exceptional 19.6% |
| Italians | 98.8 /100 | #92 | Exceptional 19.6% |
| Immigrants | Austria | 98.8 /100 | #93 | Exceptional 19.6% |
| Romanians | 98.6 /100 | #94 | Exceptional 19.6% |
| Estonians | 98.2 /100 | #95 | Exceptional 19.7% |
| Immigrants | Brazil | 98.2 /100 | #96 | Exceptional 19.7% |
| Croatians | 98.1 /100 | #97 | Exceptional 19.7% |
| Immigrants | France | 97.9 /100 | #98 | Exceptional 19.7% |
| Sierra Leoneans | 97.9 /100 | #99 | Exceptional 19.7% |