Immigrants from Bangladesh vs Italian 11th Grade
COMPARE
Immigrants from Bangladesh
Italian
11th Grade
11th Grade Comparison
Immigrants from Bangladesh
Italians
89.5%
11TH GRADE
0.0/ 100
METRIC RATING
309th/ 347
METRIC RANK
94.5%
11TH GRADE
100.0/ 100
METRIC RATING
20th/ 347
METRIC RANK
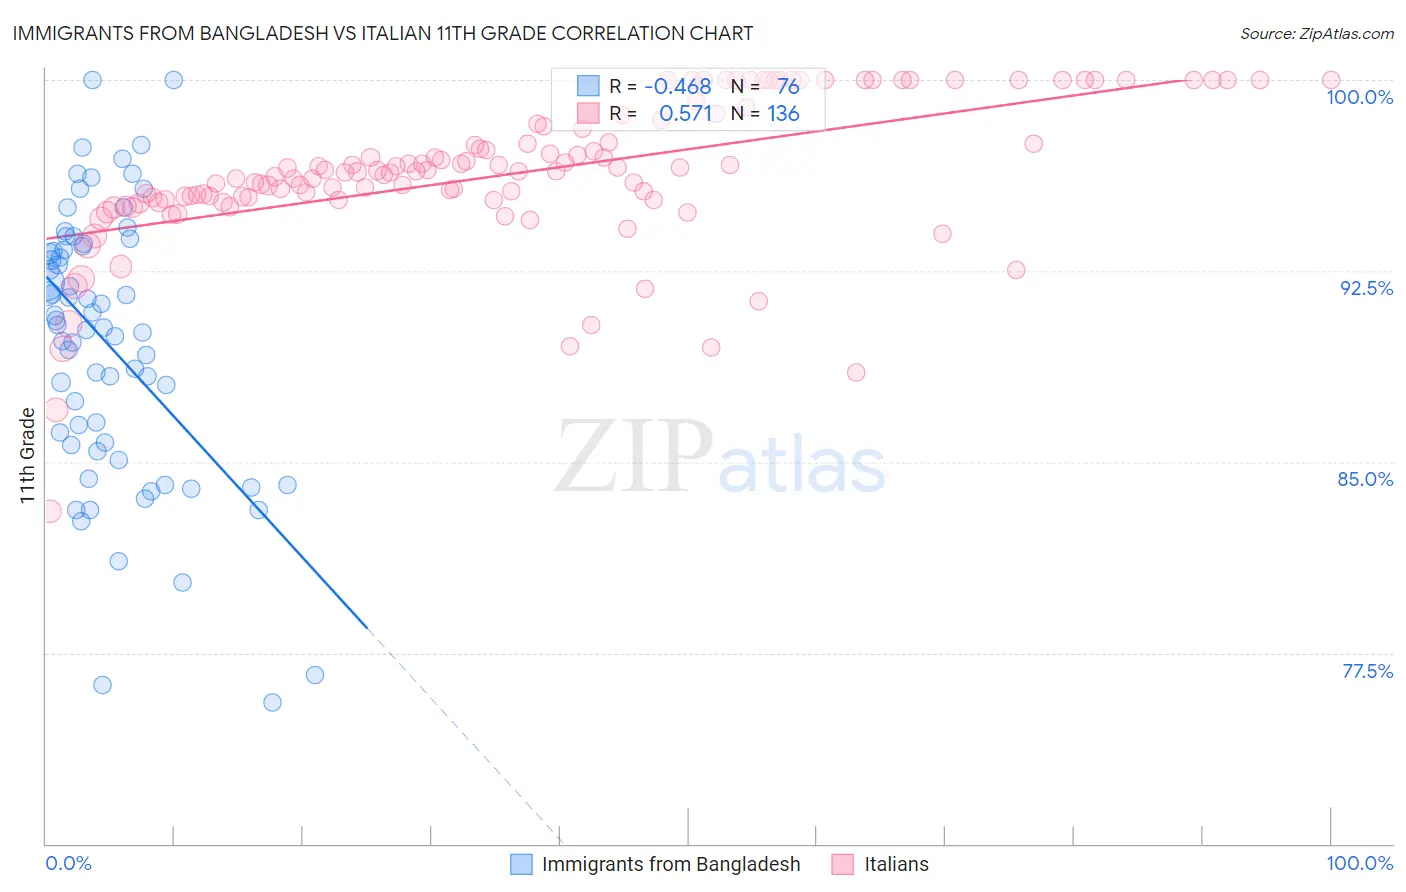
Immigrants from Bangladesh vs Italian 11th Grade Correlation Chart
The statistical analysis conducted on geographies consisting of 203,672,706 people shows a moderate negative correlation between the proportion of Immigrants from Bangladesh and percentage of population with at least 11th grade education in the United States with a correlation coefficient (R) of -0.468 and weighted average of 89.5%. Similarly, the statistical analysis conducted on geographies consisting of 575,117,260 people shows a substantial positive correlation between the proportion of Italians and percentage of population with at least 11th grade education in the United States with a correlation coefficient (R) of 0.571 and weighted average of 94.5%, a difference of 5.5%.
11th Grade Correlation Summary
| Measurement | Immigrants from Bangladesh | Italian |
| Minimum | 75.6% | 83.1% |
| Maximum | 100.0% | 100.0% |
| Range | 24.4% | 16.9% |
| Mean | 89.6% | 96.3% |
| Median | 90.3% | 96.4% |
| Interquartile 25% (IQ1) | 85.7% | 95.3% |
| Interquartile 75% (IQ3) | 93.4% | 98.2% |
| Interquartile Range (IQR) | 7.7% | 2.9% |
| Standard Deviation (Sample) | 5.3% | 2.9% |
| Standard Deviation (Population) | 5.3% | 2.9% |
Similar Demographics by 11th Grade
Demographics Similar to Immigrants from Bangladesh by 11th Grade
In terms of 11th grade, the demographic groups most similar to Immigrants from Bangladesh are Yaqui (89.5%, a difference of 0.010%), Nepalese (89.5%, a difference of 0.020%), Immigrants from Dominica (89.5%, a difference of 0.040%), Vietnamese (89.4%, a difference of 0.080%), and Ecuadorian (89.6%, a difference of 0.10%).
| Demographics | Rating | Rank | 11th Grade |
| Immigrants | Guyana | 0.0 /100 | #302 | Tragic 89.7% |
| Immigrants | Immigrants | 0.0 /100 | #303 | Tragic 89.7% |
| Yuman | 0.0 /100 | #304 | Tragic 89.7% |
| Immigrants | Cambodia | 0.0 /100 | #305 | Tragic 89.6% |
| Ecuadorians | 0.0 /100 | #306 | Tragic 89.6% |
| Immigrants | Dominica | 0.0 /100 | #307 | Tragic 89.5% |
| Nepalese | 0.0 /100 | #308 | Tragic 89.5% |
| Immigrants | Bangladesh | 0.0 /100 | #309 | Tragic 89.5% |
| Yaqui | 0.0 /100 | #310 | Tragic 89.5% |
| Vietnamese | 0.0 /100 | #311 | Tragic 89.4% |
| Immigrants | Portugal | 0.0 /100 | #312 | Tragic 89.3% |
| Immigrants | Caribbean | 0.0 /100 | #313 | Tragic 89.1% |
| Cape Verdeans | 0.0 /100 | #314 | Tragic 89.1% |
| Immigrants | Ecuador | 0.0 /100 | #315 | Tragic 89.1% |
| Immigrants | Cuba | 0.0 /100 | #316 | Tragic 88.9% |
Demographics Similar to Italians by 11th Grade
In terms of 11th grade, the demographic groups most similar to Italians are Tlingit-Haida (94.4%, a difference of 0.010%), Tsimshian (94.4%, a difference of 0.020%), Maltese (94.5%, a difference of 0.030%), Scandinavian (94.5%, a difference of 0.030%), and Czech (94.4%, a difference of 0.030%).
| Demographics | Rating | Rank | 11th Grade |
| Chinese | 100.0 /100 | #13 | Exceptional 94.6% |
| Eastern Europeans | 100.0 /100 | #14 | Exceptional 94.6% |
| Bulgarians | 100.0 /100 | #15 | Exceptional 94.5% |
| Immigrants | India | 100.0 /100 | #16 | Exceptional 94.5% |
| Luxembourgers | 100.0 /100 | #17 | Exceptional 94.5% |
| Maltese | 100.0 /100 | #18 | Exceptional 94.5% |
| Scandinavians | 100.0 /100 | #19 | Exceptional 94.5% |
| Italians | 100.0 /100 | #20 | Exceptional 94.5% |
| Tlingit-Haida | 100.0 /100 | #21 | Exceptional 94.4% |
| Tsimshian | 100.0 /100 | #22 | Exceptional 94.4% |
| Czechs | 100.0 /100 | #23 | Exceptional 94.4% |
| English | 100.0 /100 | #24 | Exceptional 94.4% |
| Irish | 100.0 /100 | #25 | Exceptional 94.4% |
| Scottish | 100.0 /100 | #26 | Exceptional 94.4% |
| Europeans | 100.0 /100 | #27 | Exceptional 94.4% |