Immigrants from Netherlands vs Liberian Poverty
COMPARE
Immigrants from Netherlands
Liberian
Poverty
Poverty Comparison
Immigrants from Netherlands
Liberians
11.2%
POVERTY
97.5/ 100
METRIC RATING
66th/ 347
METRIC RANK
14.1%
POVERTY
0.2/ 100
METRIC RATING
247th/ 347
METRIC RANK
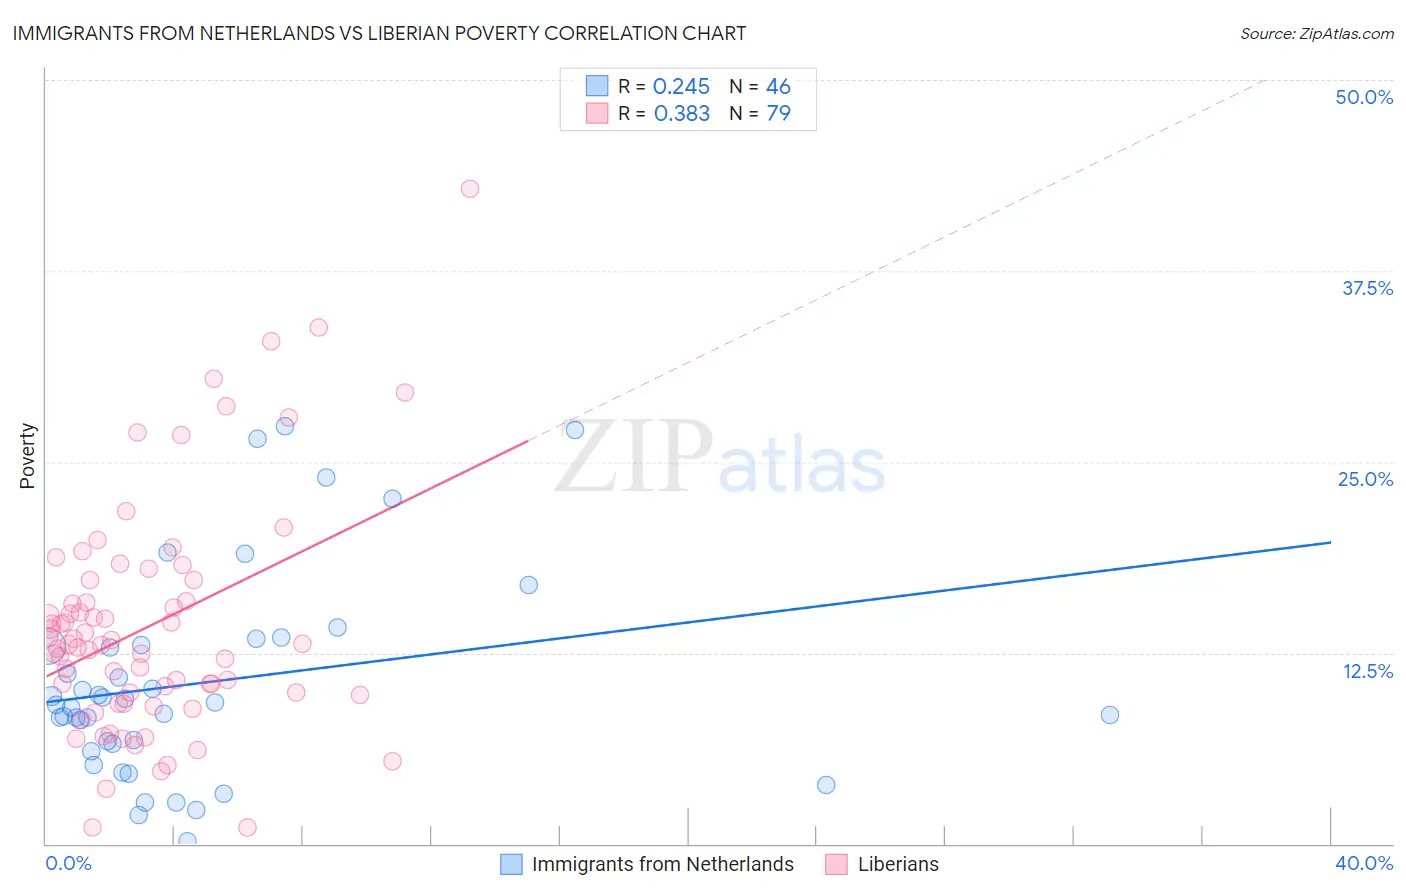
Immigrants from Netherlands vs Liberian Poverty Correlation Chart
The statistical analysis conducted on geographies consisting of 237,819,327 people shows a weak positive correlation between the proportion of Immigrants from Netherlands and poverty level in the United States with a correlation coefficient (R) of 0.245 and weighted average of 11.2%. Similarly, the statistical analysis conducted on geographies consisting of 118,042,560 people shows a mild positive correlation between the proportion of Liberians and poverty level in the United States with a correlation coefficient (R) of 0.383 and weighted average of 14.1%, a difference of 26.0%.
Poverty Correlation Summary
| Measurement | Immigrants from Netherlands | Liberian |
| Minimum | 0.13% | 1.0% |
| Maximum | 27.4% | 42.9% |
| Range | 27.2% | 41.9% |
| Mean | 10.6% | 14.3% |
| Median | 9.2% | 13.1% |
| Interquartile 25% (IQ1) | 6.6% | 9.8% |
| Interquartile 75% (IQ3) | 13.0% | 17.3% |
| Interquartile Range (IQR) | 6.4% | 7.5% |
| Standard Deviation (Sample) | 6.8% | 7.6% |
| Standard Deviation (Population) | 6.7% | 7.6% |
Similar Demographics by Poverty
Demographics Similar to Immigrants from Netherlands by Poverty
In terms of poverty, the demographic groups most similar to Immigrants from Netherlands are Immigrants from Australia (11.2%, a difference of 0.040%), Slovak (11.2%, a difference of 0.060%), Immigrants from Asia (11.2%, a difference of 0.070%), Serbian (11.2%, a difference of 0.12%), and Swiss (11.2%, a difference of 0.20%).
| Demographics | Rating | Rank | Poverty |
| Immigrants | Europe | 98.0 /100 | #59 | Exceptional 11.2% |
| Immigrants | Sri Lanka | 97.9 /100 | #60 | Exceptional 11.2% |
| Immigrants | Italy | 97.9 /100 | #61 | Exceptional 11.2% |
| Austrians | 97.8 /100 | #62 | Exceptional 11.2% |
| Ukrainians | 97.8 /100 | #63 | Exceptional 11.2% |
| Swiss | 97.7 /100 | #64 | Exceptional 11.2% |
| Immigrants | Asia | 97.5 /100 | #65 | Exceptional 11.2% |
| Immigrants | Netherlands | 97.5 /100 | #66 | Exceptional 11.2% |
| Immigrants | Australia | 97.4 /100 | #67 | Exceptional 11.2% |
| Slovaks | 97.4 /100 | #68 | Exceptional 11.2% |
| Serbians | 97.4 /100 | #69 | Exceptional 11.2% |
| Immigrants | Canada | 97.3 /100 | #70 | Exceptional 11.3% |
| Zimbabweans | 97.3 /100 | #71 | Exceptional 11.3% |
| Europeans | 97.2 /100 | #72 | Exceptional 11.3% |
| Immigrants | Belgium | 97.2 /100 | #73 | Exceptional 11.3% |
Demographics Similar to Liberians by Poverty
In terms of poverty, the demographic groups most similar to Liberians are Immigrants from Western Africa (14.1%, a difference of 0.020%), Immigrants from Ghana (14.2%, a difference of 0.11%), Potawatomi (14.1%, a difference of 0.28%), Cree (14.2%, a difference of 0.41%), and Immigrants from Sudan (14.1%, a difference of 0.48%).
| Demographics | Rating | Rank | Poverty |
| Immigrants | Middle Africa | 0.4 /100 | #240 | Tragic 14.0% |
| Salvadorans | 0.4 /100 | #241 | Tragic 14.0% |
| Ecuadorians | 0.4 /100 | #242 | Tragic 14.0% |
| Sudanese | 0.3 /100 | #243 | Tragic 14.0% |
| Nepalese | 0.3 /100 | #244 | Tragic 14.0% |
| Immigrants | Sudan | 0.3 /100 | #245 | Tragic 14.1% |
| Potawatomi | 0.3 /100 | #246 | Tragic 14.1% |
| Liberians | 0.2 /100 | #247 | Tragic 14.1% |
| Immigrants | Western Africa | 0.2 /100 | #248 | Tragic 14.1% |
| Immigrants | Ghana | 0.2 /100 | #249 | Tragic 14.2% |
| Cree | 0.2 /100 | #250 | Tragic 14.2% |
| Immigrants | Burma/Myanmar | 0.2 /100 | #251 | Tragic 14.2% |
| Spanish American Indians | 0.2 /100 | #252 | Tragic 14.2% |
| Immigrants | Trinidad and Tobago | 0.2 /100 | #253 | Tragic 14.2% |
| Immigrants | El Salvador | 0.1 /100 | #254 | Tragic 14.3% |