Immigrants from the Azores vs Immigrants from Ireland Poverty
COMPARE
Immigrants from the Azores
Immigrants from Ireland
Poverty
Poverty Comparison
Immigrants from the Azores
Immigrants from Ireland
13.1%
POVERTY
6.1/ 100
METRIC RATING
210th/ 347
METRIC RANK
10.1%
POVERTY
99.9/ 100
METRIC RATING
5th/ 347
METRIC RANK
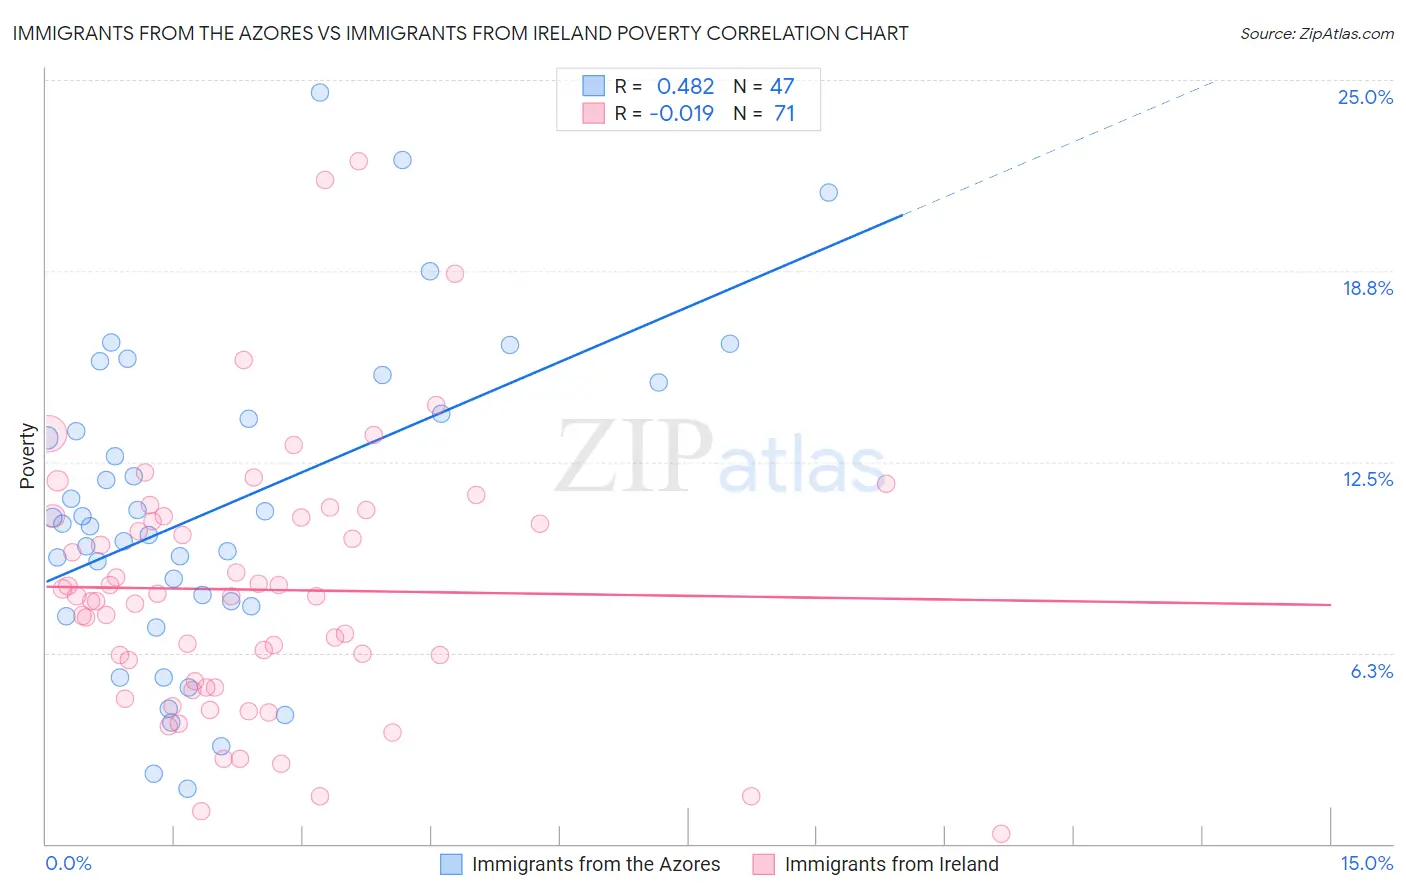
Immigrants from the Azores vs Immigrants from Ireland Poverty Correlation Chart
The statistical analysis conducted on geographies consisting of 46,256,915 people shows a moderate positive correlation between the proportion of Immigrants from the Azores and poverty level in the United States with a correlation coefficient (R) of 0.482 and weighted average of 13.1%. Similarly, the statistical analysis conducted on geographies consisting of 240,745,110 people shows no correlation between the proportion of Immigrants from Ireland and poverty level in the United States with a correlation coefficient (R) of -0.019 and weighted average of 10.1%, a difference of 30.3%.
Poverty Correlation Summary
| Measurement | Immigrants from the Azores | Immigrants from Ireland |
| Minimum | 1.8% | 0.31% |
| Maximum | 24.6% | 22.3% |
| Range | 22.8% | 22.0% |
| Mean | 11.0% | 8.3% |
| Median | 10.5% | 8.1% |
| Interquartile 25% (IQ1) | 7.8% | 5.1% |
| Interquartile 75% (IQ3) | 14.1% | 10.7% |
| Interquartile Range (IQR) | 6.3% | 5.6% |
| Standard Deviation (Sample) | 5.1% | 4.3% |
| Standard Deviation (Population) | 5.1% | 4.3% |
Similar Demographics by Poverty
Demographics Similar to Immigrants from the Azores by Poverty
In terms of poverty, the demographic groups most similar to Immigrants from the Azores are Malaysian (13.1%, a difference of 0.030%), Ugandan (13.1%, a difference of 0.060%), Panamanian (13.1%, a difference of 0.21%), Immigrants from Eastern Africa (13.1%, a difference of 0.34%), and Moroccan (13.2%, a difference of 0.35%).
| Demographics | Rating | Rank | Poverty |
| Hmong | 15.0 /100 | #203 | Poor 12.8% |
| Immigrants | Western Asia | 14.1 /100 | #204 | Poor 12.9% |
| Tsimshian | 9.2 /100 | #205 | Tragic 13.0% |
| Immigrants | Eastern Africa | 7.0 /100 | #206 | Tragic 13.1% |
| Panamanians | 6.6 /100 | #207 | Tragic 13.1% |
| Ugandans | 6.2 /100 | #208 | Tragic 13.1% |
| Malaysians | 6.1 /100 | #209 | Tragic 13.1% |
| Immigrants | Azores | 6.1 /100 | #210 | Tragic 13.1% |
| Moroccans | 5.2 /100 | #211 | Tragic 13.2% |
| Immigrants | Immigrants | 4.3 /100 | #212 | Tragic 13.2% |
| Immigrants | Panama | 4.1 /100 | #213 | Tragic 13.3% |
| Bermudans | 3.7 /100 | #214 | Tragic 13.3% |
| Japanese | 3.3 /100 | #215 | Tragic 13.3% |
| Immigrants | Nonimmigrants | 3.3 /100 | #216 | Tragic 13.3% |
| Immigrants | Uzbekistan | 3.2 /100 | #217 | Tragic 13.3% |
Demographics Similar to Immigrants from Ireland by Poverty
In terms of poverty, the demographic groups most similar to Immigrants from Ireland are Assyrian/Chaldean/Syriac (10.1%, a difference of 0.18%), Filipino (10.1%, a difference of 0.32%), Maltese (10.2%, a difference of 0.74%), Immigrants from South Central Asia (10.2%, a difference of 1.2%), and Bulgarian (10.2%, a difference of 1.6%).
| Demographics | Rating | Rank | Poverty |
| Immigrants | India | 100.0 /100 | #1 | Exceptional 9.0% |
| Chinese | 100.0 /100 | #2 | Exceptional 9.5% |
| Thais | 100.0 /100 | #3 | Exceptional 9.6% |
| Immigrants | Taiwan | 100.0 /100 | #4 | Exceptional 9.7% |
| Immigrants | Ireland | 99.9 /100 | #5 | Exceptional 10.1% |
| Assyrians/Chaldeans/Syriacs | 99.9 /100 | #6 | Exceptional 10.1% |
| Filipinos | 99.9 /100 | #7 | Exceptional 10.1% |
| Maltese | 99.9 /100 | #8 | Exceptional 10.2% |
| Immigrants | South Central Asia | 99.9 /100 | #9 | Exceptional 10.2% |
| Bulgarians | 99.9 /100 | #10 | Exceptional 10.2% |
| Immigrants | Lithuania | 99.9 /100 | #11 | Exceptional 10.3% |
| Bhutanese | 99.8 /100 | #12 | Exceptional 10.4% |
| Immigrants | Hong Kong | 99.8 /100 | #13 | Exceptional 10.4% |
| Immigrants | Bolivia | 99.8 /100 | #14 | Exceptional 10.4% |
| Bolivians | 99.8 /100 | #15 | Exceptional 10.4% |