Immigrants from Australia vs Hmong Single Female Poverty
COMPARE
Immigrants from Australia
Hmong
Single Female Poverty
Single Female Poverty Comparison
Immigrants from Australia
Hmong
19.4%
SINGLE FEMALE POVERTY
99.3/ 100
METRIC RATING
80th/ 347
METRIC RANK
23.1%
SINGLE FEMALE POVERTY
0.2/ 100
METRIC RATING
269th/ 347
METRIC RANK
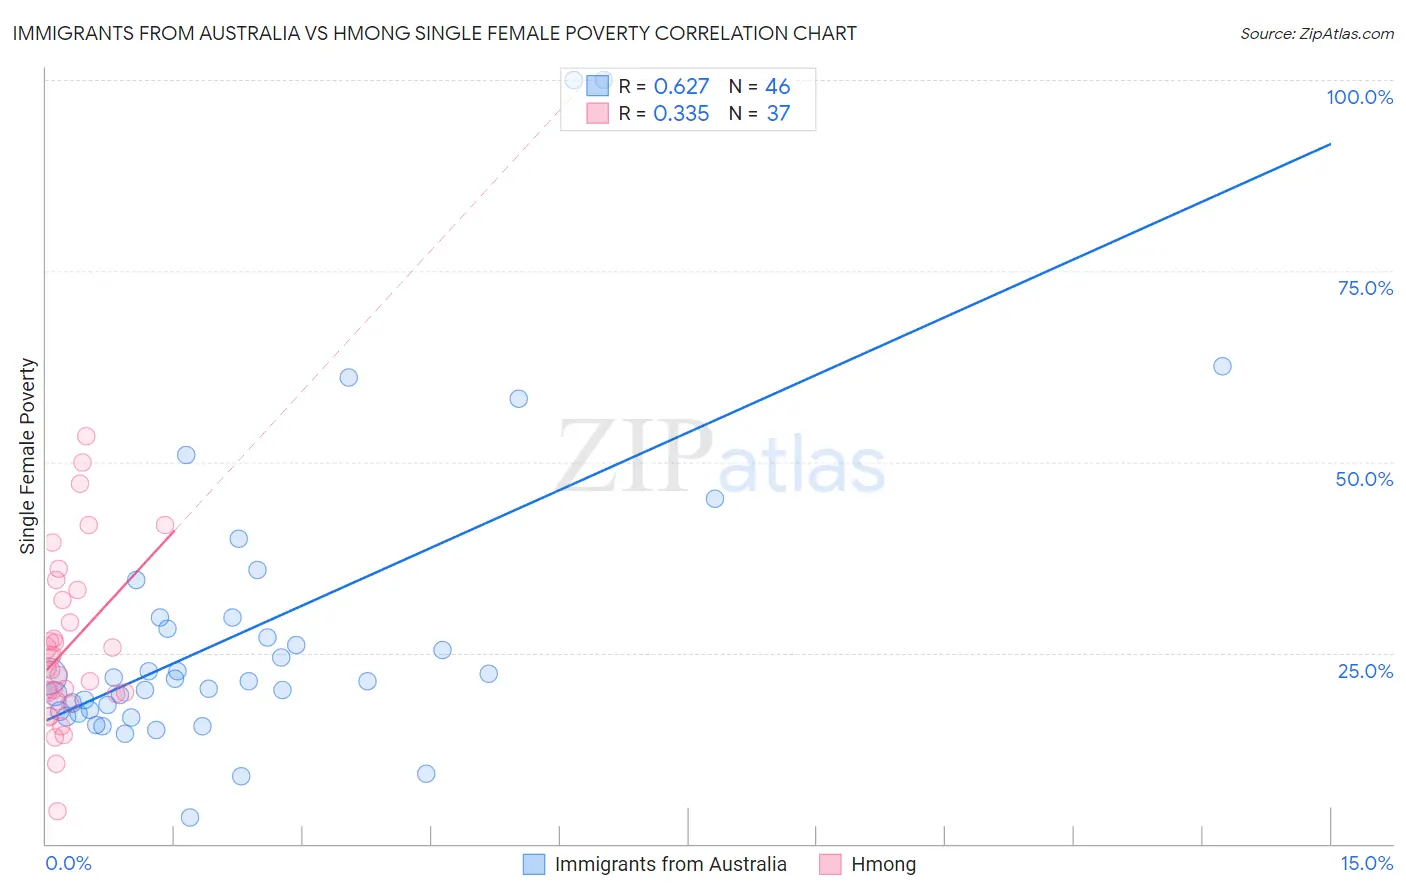
Immigrants from Australia vs Hmong Single Female Poverty Correlation Chart
The statistical analysis conducted on geographies consisting of 224,453,715 people shows a significant positive correlation between the proportion of Immigrants from Australia and poverty level among single females in the United States with a correlation coefficient (R) of 0.627 and weighted average of 19.4%. Similarly, the statistical analysis conducted on geographies consisting of 24,642,418 people shows a mild positive correlation between the proportion of Hmong and poverty level among single females in the United States with a correlation coefficient (R) of 0.335 and weighted average of 23.1%, a difference of 18.9%.
Single Female Poverty Correlation Summary
| Measurement | Immigrants from Australia | Hmong |
| Minimum | 3.5% | 4.3% |
| Maximum | 100.0% | 53.4% |
| Range | 96.5% | 49.1% |
| Mean | 28.1% | 25.8% |
| Median | 21.4% | 22.9% |
| Interquartile 25% (IQ1) | 17.3% | 19.1% |
| Interquartile 75% (IQ3) | 29.7% | 32.5% |
| Interquartile Range (IQR) | 12.3% | 13.4% |
| Standard Deviation (Sample) | 20.2% | 11.0% |
| Standard Deviation (Population) | 20.0% | 10.9% |
Similar Demographics by Single Female Poverty
Demographics Similar to Immigrants from Australia by Single Female Poverty
In terms of single female poverty, the demographic groups most similar to Immigrants from Australia are Immigrants from Scotland (19.4%, a difference of 0.020%), Immigrants from Malaysia (19.4%, a difference of 0.030%), Immigrants from Sierra Leone (19.4%, a difference of 0.040%), Taiwanese (19.4%, a difference of 0.050%), and Albanian (19.4%, a difference of 0.060%).
| Demographics | Rating | Rank | Single Female Poverty |
| Immigrants | Peru | 99.4 /100 | #73 | Exceptional 19.3% |
| Immigrants | Belarus | 99.4 /100 | #74 | Exceptional 19.3% |
| Immigrants | Turkey | 99.4 /100 | #75 | Exceptional 19.4% |
| Peruvians | 99.4 /100 | #76 | Exceptional 19.4% |
| Immigrants | Russia | 99.3 /100 | #77 | Exceptional 19.4% |
| Albanians | 99.3 /100 | #78 | Exceptional 19.4% |
| Immigrants | Sierra Leone | 99.3 /100 | #79 | Exceptional 19.4% |
| Immigrants | Australia | 99.3 /100 | #80 | Exceptional 19.4% |
| Immigrants | Scotland | 99.2 /100 | #81 | Exceptional 19.4% |
| Immigrants | Malaysia | 99.2 /100 | #82 | Exceptional 19.4% |
| Taiwanese | 99.2 /100 | #83 | Exceptional 19.4% |
| Immigrants | Sweden | 99.2 /100 | #84 | Exceptional 19.4% |
| Immigrants | Albania | 99.2 /100 | #85 | Exceptional 19.4% |
| Greeks | 99.2 /100 | #86 | Exceptional 19.4% |
| Zimbabweans | 99.0 /100 | #87 | Exceptional 19.5% |
Demographics Similar to Hmong by Single Female Poverty
In terms of single female poverty, the demographic groups most similar to Hmong are Fijian (23.1%, a difference of 0.030%), Senegalese (23.0%, a difference of 0.10%), Immigrants from Micronesia (23.0%, a difference of 0.16%), Inupiat (23.1%, a difference of 0.26%), and Central American (23.0%, a difference of 0.37%).
| Demographics | Rating | Rank | Single Female Poverty |
| British West Indians | 0.4 /100 | #262 | Tragic 22.8% |
| Scotch-Irish | 0.3 /100 | #263 | Tragic 22.9% |
| Immigrants | Laos | 0.3 /100 | #264 | Tragic 22.9% |
| Central Americans | 0.2 /100 | #265 | Tragic 23.0% |
| Immigrants | Micronesia | 0.2 /100 | #266 | Tragic 23.0% |
| Senegalese | 0.2 /100 | #267 | Tragic 23.0% |
| Fijians | 0.2 /100 | #268 | Tragic 23.1% |
| Hmong | 0.2 /100 | #269 | Tragic 23.1% |
| Inupiat | 0.2 /100 | #270 | Tragic 23.1% |
| Sub-Saharan Africans | 0.1 /100 | #271 | Tragic 23.2% |
| Immigrants | Senegal | 0.1 /100 | #272 | Tragic 23.2% |
| Alaska Natives | 0.1 /100 | #273 | Tragic 23.3% |
| Marshallese | 0.1 /100 | #274 | Tragic 23.3% |
| Mexican American Indians | 0.1 /100 | #275 | Tragic 23.4% |
| Immigrants | Azores | 0.0 /100 | #276 | Tragic 23.5% |