Immigrants from Australia vs Hmong GED/Equivalency
COMPARE
Immigrants from Australia
Hmong
GED/Equivalency
GED/Equivalency Comparison
Immigrants from Australia
Hmong
88.6%
GED/EQUIVALENCY
99.8/ 100
METRIC RATING
26th/ 347
METRIC RANK
84.9%
GED/EQUIVALENCY
13.1/ 100
METRIC RATING
207th/ 347
METRIC RANK
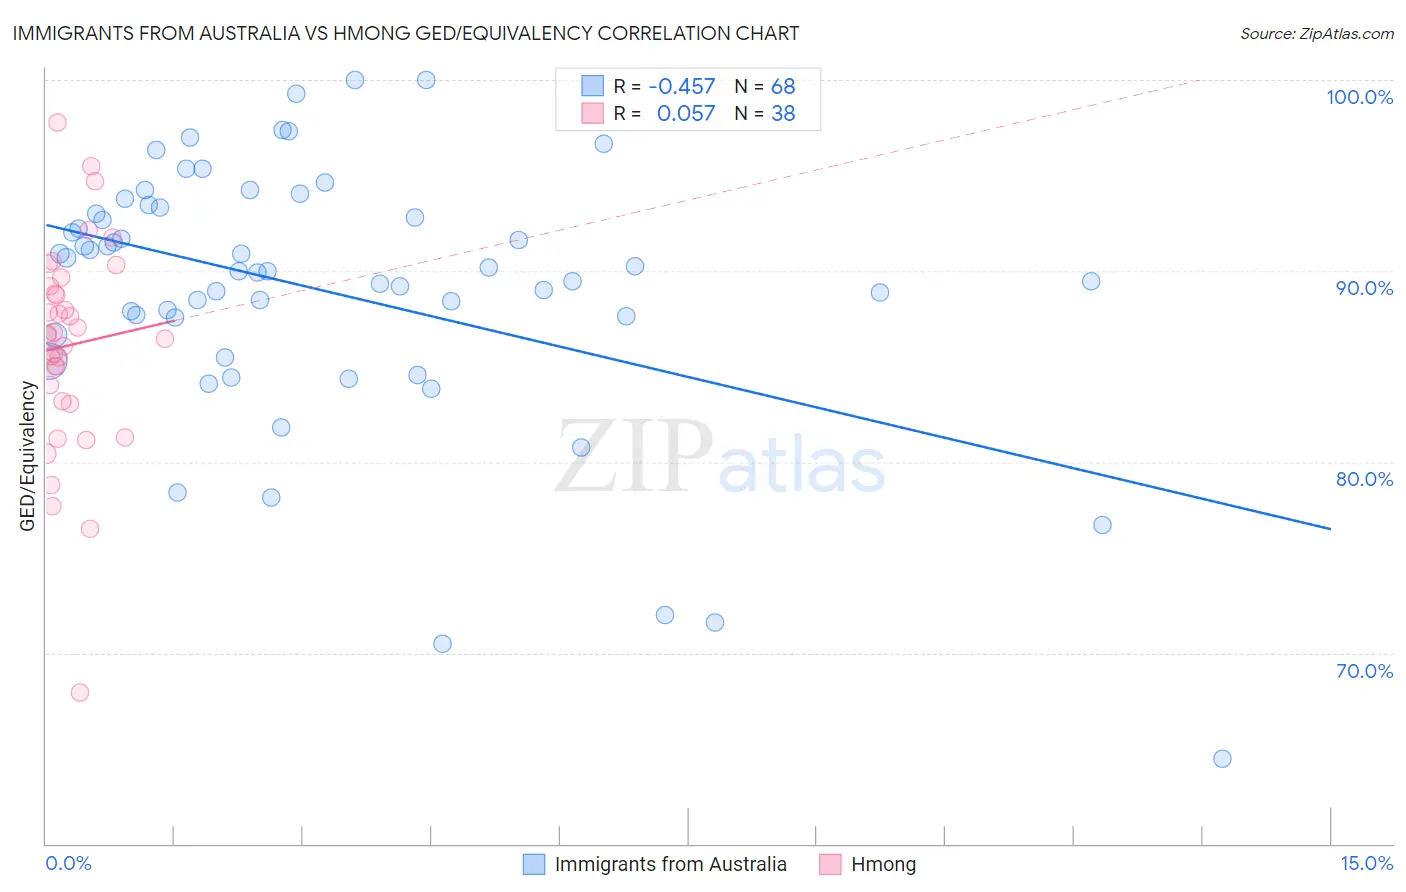
Immigrants from Australia vs Hmong GED/Equivalency Correlation Chart
The statistical analysis conducted on geographies consisting of 227,202,828 people shows a moderate negative correlation between the proportion of Immigrants from Australia and percentage of population with at least ged/equivalency education in the United States with a correlation coefficient (R) of -0.457 and weighted average of 88.6%. Similarly, the statistical analysis conducted on geographies consisting of 24,672,093 people shows a slight positive correlation between the proportion of Hmong and percentage of population with at least ged/equivalency education in the United States with a correlation coefficient (R) of 0.057 and weighted average of 84.9%, a difference of 4.3%.
GED/Equivalency Correlation Summary
| Measurement | Immigrants from Australia | Hmong |
| Minimum | 64.5% | 67.9% |
| Maximum | 100.0% | 97.8% |
| Range | 35.5% | 29.9% |
| Mean | 88.9% | 86.1% |
| Median | 90.0% | 86.7% |
| Interquartile 25% (IQ1) | 87.1% | 83.2% |
| Interquartile 75% (IQ3) | 93.2% | 89.2% |
| Interquartile Range (IQR) | 6.1% | 6.0% |
| Standard Deviation (Sample) | 6.9% | 5.6% |
| Standard Deviation (Population) | 6.9% | 5.5% |
Similar Demographics by GED/Equivalency
Demographics Similar to Immigrants from Australia by GED/Equivalency
In terms of ged/equivalency, the demographic groups most similar to Immigrants from Australia are Slovak (88.6%, a difference of 0.0%), Estonian (88.6%, a difference of 0.0%), Russian (88.6%, a difference of 0.010%), Immigrants from Ireland (88.6%, a difference of 0.020%), and Luxembourger (88.6%, a difference of 0.030%).
| Demographics | Rating | Rank | GED/Equivalency |
| Swedes | 99.9 /100 | #19 | Exceptional 88.8% |
| Maltese | 99.9 /100 | #20 | Exceptional 88.6% |
| Luxembourgers | 99.8 /100 | #21 | Exceptional 88.6% |
| Immigrants | Ireland | 99.8 /100 | #22 | Exceptional 88.6% |
| Russians | 99.8 /100 | #23 | Exceptional 88.6% |
| Slovaks | 99.8 /100 | #24 | Exceptional 88.6% |
| Estonians | 99.8 /100 | #25 | Exceptional 88.6% |
| Immigrants | Australia | 99.8 /100 | #26 | Exceptional 88.6% |
| Immigrants | Lithuania | 99.8 /100 | #27 | Exceptional 88.6% |
| Immigrants | Northern Europe | 99.8 /100 | #28 | Exceptional 88.5% |
| Poles | 99.8 /100 | #29 | Exceptional 88.5% |
| Turks | 99.8 /100 | #30 | Exceptional 88.5% |
| Bhutanese | 99.8 /100 | #31 | Exceptional 88.4% |
| Danes | 99.8 /100 | #32 | Exceptional 88.4% |
| Immigrants | Sweden | 99.7 /100 | #33 | Exceptional 88.4% |
Demographics Similar to Hmong by GED/Equivalency
In terms of ged/equivalency, the demographic groups most similar to Hmong are Samoan (84.9%, a difference of 0.020%), Marshallese (84.9%, a difference of 0.030%), Colombian (84.9%, a difference of 0.040%), Immigrants from Cameroon (84.9%, a difference of 0.050%), and Liberian (85.0%, a difference of 0.060%).
| Demographics | Rating | Rank | GED/Equivalency |
| Uruguayans | 16.0 /100 | #200 | Poor 85.0% |
| Portuguese | 15.9 /100 | #201 | Poor 85.0% |
| Cree | 15.9 /100 | #202 | Poor 85.0% |
| Panamanians | 15.3 /100 | #203 | Poor 85.0% |
| Hawaiians | 15.2 /100 | #204 | Poor 85.0% |
| Liberians | 14.6 /100 | #205 | Poor 85.0% |
| Samoans | 13.7 /100 | #206 | Poor 84.9% |
| Hmong | 13.1 /100 | #207 | Poor 84.9% |
| Marshallese | 12.5 /100 | #208 | Poor 84.9% |
| Colombians | 12.3 /100 | #209 | Poor 84.9% |
| Immigrants | Cameroon | 12.1 /100 | #210 | Poor 84.9% |
| South Americans | 10.9 /100 | #211 | Poor 84.8% |
| Immigrants | Somalia | 10.6 /100 | #212 | Poor 84.8% |
| Immigrants | Philippines | 10.0 /100 | #213 | Poor 84.8% |
| Osage | 9.5 /100 | #214 | Tragic 84.8% |