Malaysian vs Immigrants from Ukraine Child Poverty Under the Age of 5
COMPARE
Malaysian
Immigrants from Ukraine
Child Poverty Under the Age of 5
Child Poverty Under the Age of 5 Comparison
Malaysians
Immigrants from Ukraine
18.4%
CHILD POVERTY UNDER THE AGE OF 5
6.5/ 100
METRIC RATING
214th/ 347
METRIC RANK
15.3%
CHILD POVERTY UNDER THE AGE OF 5
98.7/ 100
METRIC RATING
73rd/ 347
METRIC RANK
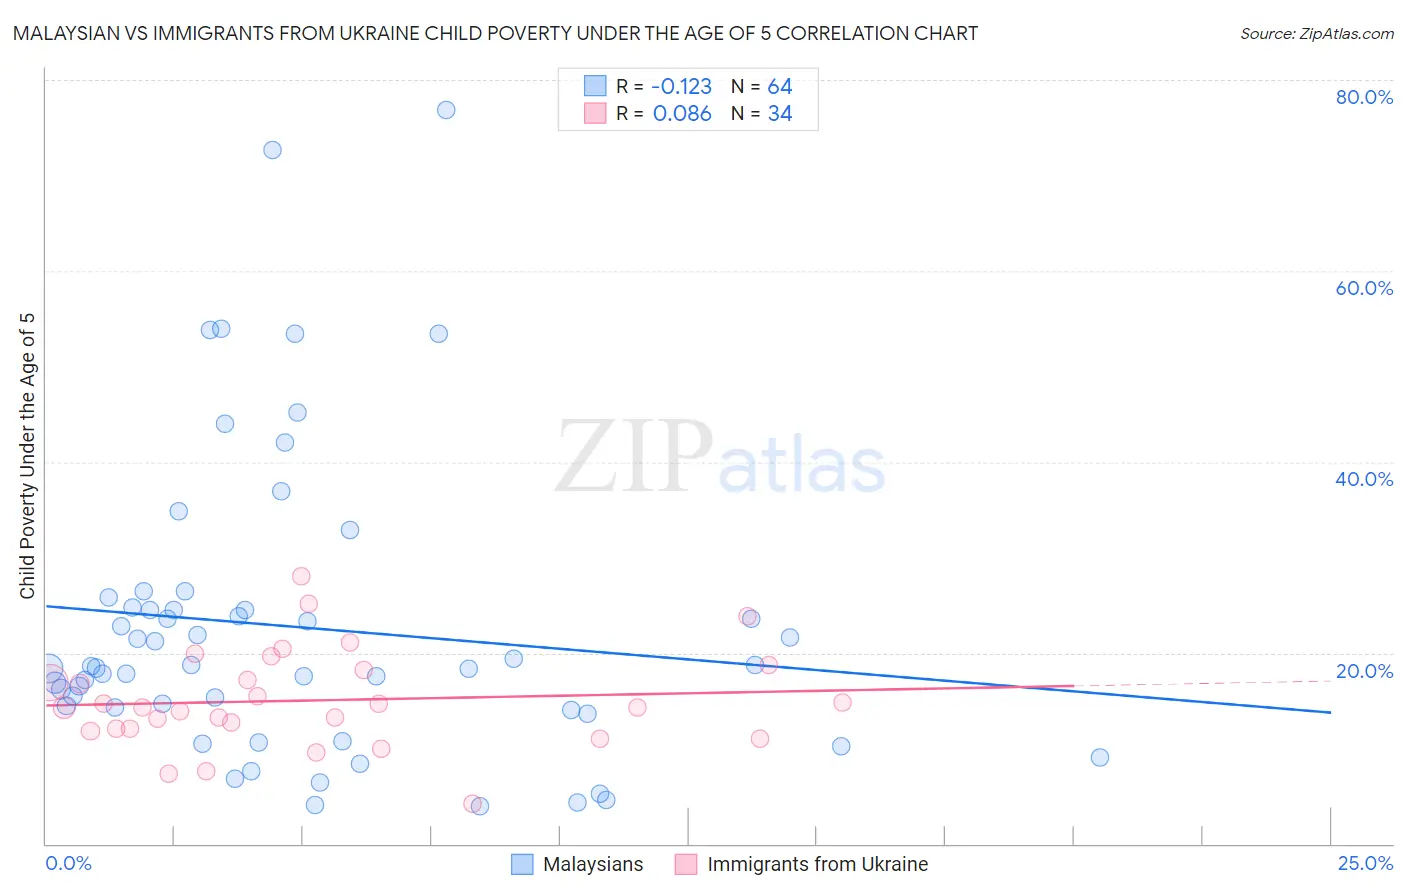
Malaysian vs Immigrants from Ukraine Child Poverty Under the Age of 5 Correlation Chart
The statistical analysis conducted on geographies consisting of 221,749,589 people shows a poor negative correlation between the proportion of Malaysians and poverty level among children under the age of 5 in the United States with a correlation coefficient (R) of -0.123 and weighted average of 18.4%. Similarly, the statistical analysis conducted on geographies consisting of 277,960,196 people shows a slight positive correlation between the proportion of Immigrants from Ukraine and poverty level among children under the age of 5 in the United States with a correlation coefficient (R) of 0.086 and weighted average of 15.3%, a difference of 20.4%.
Child Poverty Under the Age of 5 Correlation Summary
| Measurement | Malaysian | Immigrants from Ukraine |
| Minimum | 4.0% | 4.2% |
| Maximum | 76.9% | 28.0% |
| Range | 73.0% | 23.8% |
| Mean | 22.7% | 15.0% |
| Median | 18.5% | 14.3% |
| Interquartile 25% (IQ1) | 14.1% | 12.0% |
| Interquartile 75% (IQ3) | 24.6% | 18.2% |
| Interquartile Range (IQR) | 10.5% | 6.2% |
| Standard Deviation (Sample) | 15.6% | 5.1% |
| Standard Deviation (Population) | 15.5% | 5.0% |
Similar Demographics by Child Poverty Under the Age of 5
Demographics Similar to Malaysians by Child Poverty Under the Age of 5
In terms of child poverty under the age of 5, the demographic groups most similar to Malaysians are Immigrants from Panama (18.5%, a difference of 0.20%), Hmong (18.5%, a difference of 0.66%), Immigrants from Thailand (18.3%, a difference of 0.76%), Nepalese (18.3%, a difference of 0.78%), and Immigrants from Africa (18.6%, a difference of 0.87%).
| Demographics | Rating | Rank | Child Poverty Under the Age of 5 |
| Immigrants | Immigrants | 9.9 /100 | #207 | Tragic 18.2% |
| Scotch-Irish | 9.8 /100 | #208 | Tragic 18.2% |
| Spanish | 9.8 /100 | #209 | Tragic 18.2% |
| Panamanians | 9.7 /100 | #210 | Tragic 18.2% |
| Moroccans | 9.4 /100 | #211 | Tragic 18.2% |
| Nepalese | 8.7 /100 | #212 | Tragic 18.3% |
| Immigrants | Thailand | 8.6 /100 | #213 | Tragic 18.3% |
| Malaysians | 6.5 /100 | #214 | Tragic 18.4% |
| Immigrants | Panama | 6.0 /100 | #215 | Tragic 18.5% |
| Hmong | 5.0 /100 | #216 | Tragic 18.5% |
| Immigrants | Africa | 4.6 /100 | #217 | Tragic 18.6% |
| Delaware | 3.4 /100 | #218 | Tragic 18.7% |
| German Russians | 3.0 /100 | #219 | Tragic 18.8% |
| Immigrants | Azores | 2.6 /100 | #220 | Tragic 18.9% |
| Immigrants | Nigeria | 2.1 /100 | #221 | Tragic 19.0% |
Demographics Similar to Immigrants from Ukraine by Child Poverty Under the Age of 5
In terms of child poverty under the age of 5, the demographic groups most similar to Immigrants from Ukraine are Immigrants from Sweden (15.3%, a difference of 0.23%), Immigrants from Belgium (15.3%, a difference of 0.30%), Immigrants from Egypt (15.3%, a difference of 0.30%), Argentinean (15.4%, a difference of 0.36%), and Immigrants from Argentina (15.4%, a difference of 0.51%).
| Demographics | Rating | Rank | Child Poverty Under the Age of 5 |
| Immigrants | Scotland | 99.0 /100 | #66 | Exceptional 15.2% |
| Greeks | 99.0 /100 | #67 | Exceptional 15.2% |
| Zimbabweans | 99.0 /100 | #68 | Exceptional 15.2% |
| Lithuanians | 99.0 /100 | #69 | Exceptional 15.2% |
| Immigrants | Belgium | 98.8 /100 | #70 | Exceptional 15.3% |
| Immigrants | Egypt | 98.8 /100 | #71 | Exceptional 15.3% |
| Immigrants | Sweden | 98.8 /100 | #72 | Exceptional 15.3% |
| Immigrants | Ukraine | 98.7 /100 | #73 | Exceptional 15.3% |
| Argentineans | 98.5 /100 | #74 | Exceptional 15.4% |
| Immigrants | Argentina | 98.5 /100 | #75 | Exceptional 15.4% |
| Croatians | 98.5 /100 | #76 | Exceptional 15.4% |
| Immigrants | Turkey | 98.3 /100 | #77 | Exceptional 15.4% |
| Sri Lankans | 98.1 /100 | #78 | Exceptional 15.5% |
| Australians | 98.0 /100 | #79 | Exceptional 15.5% |
| Italians | 97.9 /100 | #80 | Exceptional 15.5% |