Immigrants from Dominican Republic vs Immigrants from Ukraine Child Poverty Under the Age of 5

COMPARE

Immigrants from Dominican Republic
Race
Ancestry
AfghanAfricanAlaska NativeAlaskan AthabascanAlbanianAleutAlsatianAmericanApacheArabArapahoArgentineanArmenianAssyrian/Chaldean/SyriacAustralianAustrianBahamianBangladeshiBarbadianBasqueBelgianBelizeanBermudanBhutaneseBlackfeetBolivianBrazilianBritishBritish West IndianBulgarianBurmeseCajunCambodianCanadianCape VerdeanCarpatho RusynCelticCentral AmericanCentral American IndianCherokeeCheyenneChickasawChileanChineseChippewaChoctawColombianColvilleComancheCosta RicanCreeCreekCroatianCrowCubanCypriotCzechCzechoslovakianDanishDelawareDominicanDutchDutch West IndianEastern EuropeanEcuadorianEgyptianEnglishEstonianEthiopianEuropeanFijianFilipinoFinnishFrenchFrench American IndianFrench CanadianGermanGerman RussianGhanaianGreekGuamanian/ChamorroGuatemalanGuyaneseHaitianHmongHonduranHopiHoumaHungarianIcelanderIndian (Asian)IndonesianInupiatIranianIraqiIrishIroquoisIsraeliItalianJamaicanJapaneseJordanianKenyanKiowaKoreanLaotianLatvianLebaneseLiberianLithuanianLumbeeLuxembourgerMacedonianMalaysianMalteseMarshalleseMenomineeMexicanMexican American IndianMongolianMoroccanNative HawaiianNavajoNepaleseNew ZealanderNicaraguanNigerianNorthern EuropeanNorwegianOkinawanOsageOttawaPaiutePakistaniPalestinianPanamanianParaguayanPennsylvania GermanPeruvianPimaPolishPortuguesePotawatomiPuebloPuerto RicanPuget Sound SalishRomanianRussianSalvadoranSamoanScandinavianScotch-IrishScottishSeminoleSenegaleseSerbianShoshoneSierra LeoneanSiouxSlavicSlovakSloveneSomaliSouth AfricanSouth AmericanSouth American IndianSoviet UnionSpaniardSpanishSpanish AmericanSpanish American IndianSri LankanSubsaharan AfricanSudaneseSwedishSwissSyrianTaiwaneseThaiTlingit-HaidaTohono O'OdhamTonganTrinidadian and TobagonianTsimshianTurkishU.S. Virgin IslanderUgandanUkrainianUruguayanUteVenezuelanVietnameseWelshWest IndianYakamaYaquiYugoslavianYumanYup'ikZimbabwean
Immigration
NonimmigrantsImmigrantsAfghanistanAfricaAlbaniaArgentinaArmeniaAsiaAustraliaAustriaBahamasBangladeshBarbadosBelarusBelgiumBelizeBoliviaBosnia and HerzegovinaBrazilBulgariaBurma/MyanmarCabo VerdeCambodiaCameroonCanadaCaribbeanCentral AmericaChileChinaColombiaCongoCosta RicaCroatiaCubaCzechoslovakiaDenmarkDominicaDominican RepublicEastern AfricaEastern AsiaEastern EuropeEcuadorEgyptEl SalvadorEnglandEritreaEthiopiaEuropeFijiFranceGermanyGhanaGreeceGrenadaGuatemalaGuyanaHaitiHondurasHong KongHungaryIndiaIndonesiaIranIraqIrelandIsraelItalyJamaicaJapanJordanKazakhstanKenyaKoreaKuwaitLaosLatin AmericaLatviaLebanonLiberiaLithuaniaMalaysiaMexicoMicronesiaMiddle AfricaMoldovaMoroccoNepalNetherlandsNicaraguaNigeriaNorth AmericaNorth MacedoniaNorthern AfricaNorthern EuropeNorwayOceaniaPakistanPanamaPeruPhilippinesPolandPortugalRomaniaRussiaSaudi ArabiaScotlandSenegalSerbiaSierra LeoneSingaporeSomaliaSouth AfricaSouth AmericaSouth Central AsiaSouth Eastern AsiaSouthern EuropeSpainSri LankaSt. Vincent and the GrenadinesSudanSwedenSwitzerlandSyriaTaiwanThailandTrinidad and TobagoTurkeyUgandaUruguayUzbekistanVenezuelaVietnamWest IndiesWestern AfricaWestern AsiaWestern EuropeYemenZaireZimbabweAzores
Immigrants from Ukraine
Race
Ancestry
AfghanAfricanAlaska NativeAlaskan AthabascanAlbanianAleutAlsatianAmericanApacheArabArapahoArgentineanArmenianAssyrian/Chaldean/SyriacAustralianAustrianBahamianBangladeshiBarbadianBasqueBelgianBelizeanBermudanBhutaneseBlackfeetBolivianBrazilianBritishBritish West IndianBulgarianBurmeseCajunCambodianCanadianCape VerdeanCarpatho RusynCelticCentral AmericanCentral American IndianCherokeeCheyenneChickasawChileanChineseChippewaChoctawColombianColvilleComancheCosta RicanCreeCreekCroatianCrowCubanCypriotCzechCzechoslovakianDanishDelawareDominicanDutchDutch West IndianEastern EuropeanEcuadorianEgyptianEnglishEstonianEthiopianEuropeanFijianFilipinoFinnishFrenchFrench American IndianFrench CanadianGermanGerman RussianGhanaianGreekGuamanian/ChamorroGuatemalanGuyaneseHaitianHmongHonduranHopiHoumaHungarianIcelanderIndian (Asian)IndonesianInupiatIranianIraqiIrishIroquoisIsraeliItalianJamaicanJapaneseJordanianKenyanKiowaKoreanLaotianLatvianLebaneseLiberianLithuanianLumbeeLuxembourgerMacedonianMalaysianMalteseMarshalleseMenomineeMexicanMexican American IndianMongolianMoroccanNative HawaiianNavajoNepaleseNew ZealanderNicaraguanNigerianNorthern EuropeanNorwegianOkinawanOsageOttawaPaiutePakistaniPalestinianPanamanianParaguayanPennsylvania GermanPeruvianPimaPolishPortuguesePotawatomiPuebloPuerto RicanPuget Sound SalishRomanianRussianSalvadoranSamoanScandinavianScotch-IrishScottishSeminoleSenegaleseSerbianShoshoneSierra LeoneanSiouxSlavicSlovakSloveneSomaliSouth AfricanSouth AmericanSouth American IndianSoviet UnionSpaniardSpanishSpanish AmericanSpanish American IndianSri LankanSubsaharan AfricanSudaneseSwedishSwissSyrianTaiwaneseThaiTlingit-HaidaTohono O'OdhamTonganTrinidadian and TobagonianTsimshianTurkishU.S. Virgin IslanderUgandanUkrainianUruguayanUteVenezuelanVietnameseWelshWest IndianYakamaYaquiYugoslavianYumanYup'ikZimbabwean
Immigration
NonimmigrantsImmigrantsAfghanistanAfricaAlbaniaArgentinaArmeniaAsiaAustraliaAustriaBahamasBangladeshBarbadosBelarusBelgiumBelizeBoliviaBosnia and HerzegovinaBrazilBulgariaBurma/MyanmarCabo VerdeCambodiaCameroonCanadaCaribbeanCentral AmericaChileChinaColombiaCongoCosta RicaCroatiaCubaCzechoslovakiaDenmarkDominicaEastern AfricaEastern AsiaEastern EuropeEcuadorEgyptEl SalvadorEnglandEritreaEthiopiaEuropeFijiFranceGermanyGhanaGreeceGrenadaGuatemalaGuyanaHaitiHondurasHong KongHungaryIndiaIndonesiaIranIraqIrelandIsraelItalyJamaicaJapanJordanKazakhstanKenyaKoreaKuwaitLaosLatin AmericaLatviaLebanonLiberiaLithuaniaMalaysiaMexicoMicronesiaMiddle AfricaMoldovaMoroccoNepalNetherlandsNicaraguaNigeriaNorth AmericaNorth MacedoniaNorthern AfricaNorthern EuropeNorwayOceaniaPakistanPanamaPeruPhilippinesPolandPortugalRomaniaRussiaSaudi ArabiaScotlandSenegalSerbiaSierra LeoneSingaporeSomaliaSouth AfricaSouth AmericaSouth Central AsiaSouth Eastern AsiaSouthern EuropeSpainSri LankaSt. Vincent and the GrenadinesSudanSwedenSwitzerlandSyriaTaiwanThailandTrinidad and TobagoTurkeyUgandaUkraineUruguayUzbekistanVenezuelaVietnamWest IndiesWestern AfricaWestern AsiaWestern EuropeYemenZaireZimbabweAzores
Child Poverty Under the Age of 5
Income
Poverty
Unemployment
Labor Participation
Family Structure
Vehicle Availability
Education Level
Disability

Child Poverty Under the Age of 5 Comparison

Immigrants from Dominican Republic

Immigrants from Ukraine

Tragic
Exceptional
24.1%
CHILD POVERTY UNDER THE AGE OF 5
0.0/ 100
METRIC RATING
328th/ 347
METRIC RANK
15.3%
CHILD POVERTY UNDER THE AGE OF 5
98.7/ 100
METRIC RATING
73rd/ 347
METRIC RANK

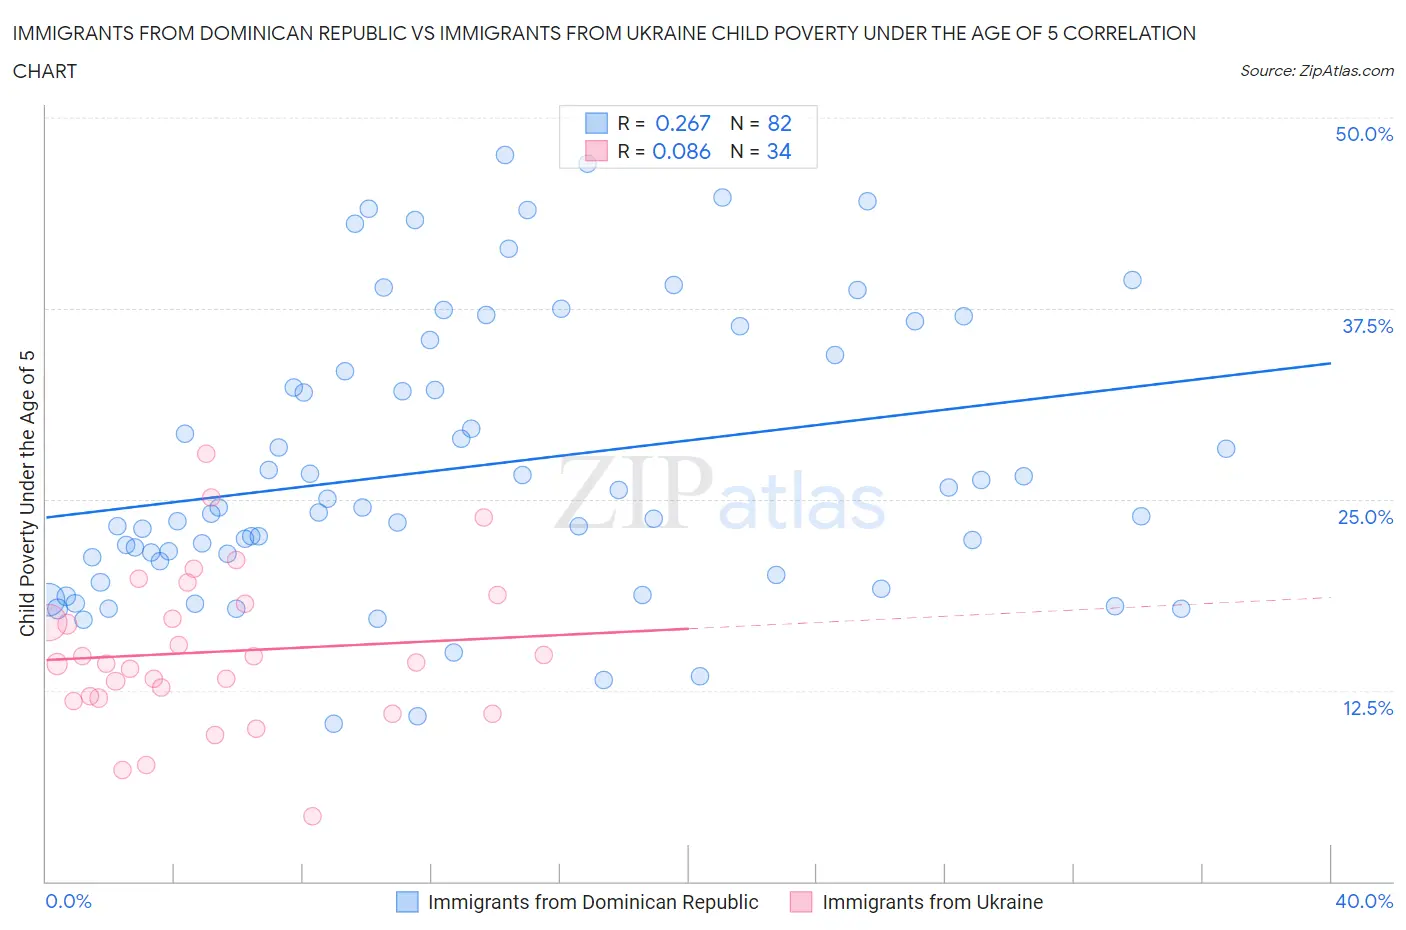
Immigrants from Dominican Republic vs Immigrants from Ukraine Child Poverty Under the Age of 5 Correlation Chart

The statistical analysis conducted on geographies consisting of 266,224,644 people shows a weak positive correlation between the proportion of Immigrants from Dominican Republic and poverty level among children under the age of 5 in the United States with a correlation coefficient (R) of 0.267 and weighted average of 24.1%. Similarly, the statistical analysis conducted on geographies consisting of 277,960,196 people shows a slight positive correlation between the proportion of Immigrants from Ukraine and poverty level among children under the age of 5 in the United States with a correlation coefficient (R) of 0.086 and weighted average of 15.3%, a difference of 57.3%.
Immigrants from Dominican Republic vs Immigrants from Ukraine Child Poverty Under the Age of 5

Child Poverty Under the Age of 5 Correlation Summary

MeasurementImmigrants from Dominican RepublicImmigrants from Ukraine
Minimum10.3%4.2%
Maximum47.5%28.0%
Range37.2%23.8%
Mean27.1%15.0%
Median24.3%14.3%
Interquartile 25% (IQ1)20.9%12.0%
Interquartile 75% (IQ3)34.4%18.2%
Interquartile Range (IQR)13.5%6.2%
Standard Deviation (Sample)9.2%5.1%
Standard Deviation (Population)9.1%5.0%

Similar Demographics by Child Poverty Under the Age of 5

Demographics Similar to Immigrants from Dominican Republic by Child Poverty Under the Age of 5

In terms of child poverty under the age of 5, the demographic groups most similar to Immigrants from Dominican Republic are Dominican (24.0%, a difference of 0.090%), Cajun (24.1%, a difference of 0.23%), Central American Indian (23.9%, a difference of 0.55%), Creek (24.2%, a difference of 0.67%), and Immigrants from Congo (23.9%, a difference of 0.73%).
DemographicsRating | RankChild Poverty Under the Age of 5
Immigrants | Honduras
0.0
/100
|
#321
Tragic
23.5%
Ute
0.0
/100
|
#322
Tragic
23.5%
Pueblo
0.0
/100
|
#323
Tragic
23.7%
Paiute
0.0
/100
|
#324
Tragic
23.8%
Immigrants | Congo
0.0
/100
|
#325
Tragic
23.9%
Central American Indians
0.0
/100
|
#326
Tragic
23.9%
Dominicans
0.0
/100
|
#327
Tragic
24.0%
Immigrants | Dominican Republic
0.0
/100
|
#328
Tragic
24.1%
Cajuns
0.0
/100
|
#329
Tragic
24.1%
Creek
0.0
/100
|
#330
Tragic
24.2%
Kiowa
0.0
/100
|
#331
Tragic
24.5%
Apache
0.0
/100
|
#332
Tragic
25.0%
Natives/Alaskans
0.0
/100
|
#333
Tragic
25.6%
Blacks/African Americans
0.0
/100
|
#334
Tragic
25.7%
Colville
0.0
/100
|
#335
Tragic
25.7%

Demographics Similar to Immigrants from Ukraine by Child Poverty Under the Age of 5

In terms of child poverty under the age of 5, the demographic groups most similar to Immigrants from Ukraine are Immigrants from Sweden (15.3%, a difference of 0.23%), Immigrants from Belgium (15.3%, a difference of 0.30%), Immigrants from Egypt (15.3%, a difference of 0.30%), Argentinean (15.4%, a difference of 0.36%), and Immigrants from Argentina (15.4%, a difference of 0.51%).
DemographicsRating | RankChild Poverty Under the Age of 5
Immigrants | Scotland
99.0
/100
|
#66
Exceptional
15.2%
Greeks
99.0
/100
|
#67
Exceptional
15.2%
Zimbabweans
99.0
/100
|
#68
Exceptional
15.2%
Lithuanians
99.0
/100
|
#69
Exceptional
15.2%
Immigrants | Belgium
98.8
/100
|
#70
Exceptional
15.3%
Immigrants | Egypt
98.8
/100
|
#71
Exceptional
15.3%
Immigrants | Sweden
98.8
/100
|
#72
Exceptional
15.3%
Immigrants | Ukraine
98.7
/100
|
#73
Exceptional
15.3%
Argentineans
98.5
/100
|
#74
Exceptional
15.4%
Immigrants | Argentina
98.5
/100
|
#75
Exceptional
15.4%
Croatians
98.5
/100
|
#76
Exceptional
15.4%
Immigrants | Turkey
98.3
/100
|
#77
Exceptional
15.4%
Sri Lankans
98.1
/100
|
#78
Exceptional
15.5%
Australians
98.0
/100
|
#79
Exceptional
15.5%
Italians
97.9
/100
|
#80
Exceptional
15.5%