Immigrants from Northern Africa vs Immigrants from Ukraine Child Poverty Under the Age of 5
COMPARE
Immigrants from Northern Africa
Immigrants from Ukraine
Child Poverty Under the Age of 5
Child Poverty Under the Age of 5 Comparison
Immigrants from Northern Africa
Immigrants from Ukraine
16.4%
CHILD POVERTY UNDER THE AGE OF 5
87.5/ 100
METRIC RATING
136th/ 347
METRIC RANK
15.3%
CHILD POVERTY UNDER THE AGE OF 5
98.7/ 100
METRIC RATING
73rd/ 347
METRIC RANK
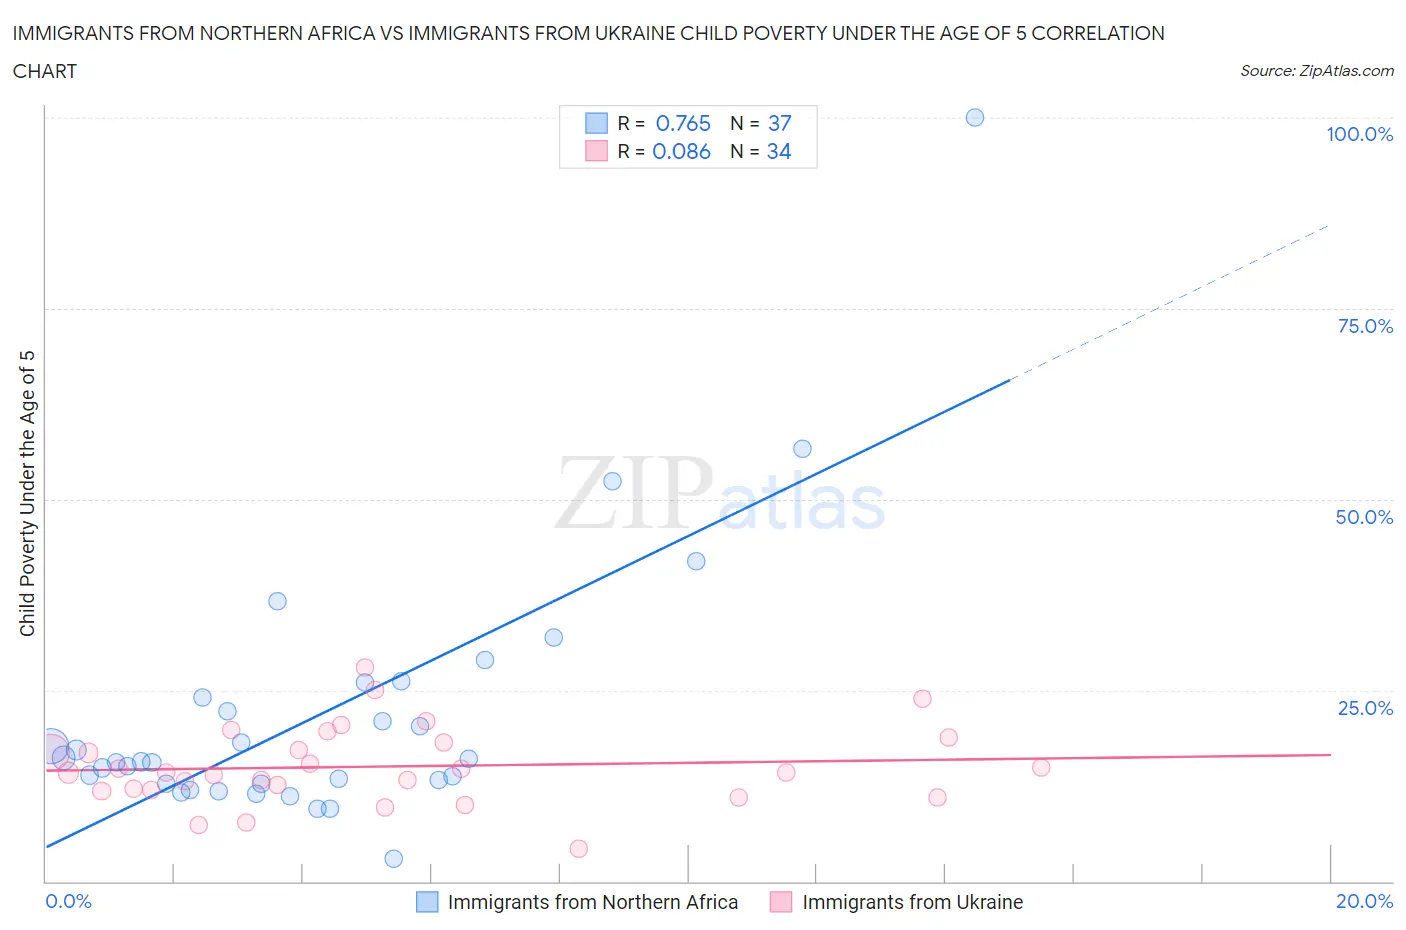
Immigrants from Northern Africa vs Immigrants from Ukraine Child Poverty Under the Age of 5 Correlation Chart
The statistical analysis conducted on geographies consisting of 310,197,914 people shows a strong positive correlation between the proportion of Immigrants from Northern Africa and poverty level among children under the age of 5 in the United States with a correlation coefficient (R) of 0.765 and weighted average of 16.4%. Similarly, the statistical analysis conducted on geographies consisting of 277,960,196 people shows a slight positive correlation between the proportion of Immigrants from Ukraine and poverty level among children under the age of 5 in the United States with a correlation coefficient (R) of 0.086 and weighted average of 15.3%, a difference of 7.0%.
Child Poverty Under the Age of 5 Correlation Summary
| Measurement | Immigrants from Northern Africa | Immigrants from Ukraine |
| Minimum | 2.9% | 4.2% |
| Maximum | 100.0% | 28.0% |
| Range | 97.1% | 23.8% |
| Mean | 21.9% | 15.0% |
| Median | 15.6% | 14.3% |
| Interquartile 25% (IQ1) | 12.8% | 12.0% |
| Interquartile 75% (IQ3) | 25.0% | 18.2% |
| Interquartile Range (IQR) | 12.2% | 6.2% |
| Standard Deviation (Sample) | 17.5% | 5.1% |
| Standard Deviation (Population) | 17.3% | 5.0% |
Similar Demographics by Child Poverty Under the Age of 5
Demographics Similar to Immigrants from Northern Africa by Child Poverty Under the Age of 5
In terms of child poverty under the age of 5, the demographic groups most similar to Immigrants from Northern Africa are Brazilian (16.4%, a difference of 0.060%), Immigrants from North Macedonia (16.4%, a difference of 0.070%), Icelander (16.3%, a difference of 0.090%), Serbian (16.3%, a difference of 0.16%), and Finnish (16.3%, a difference of 0.19%).
| Demographics | Rating | Rank | Child Poverty Under the Age of 5 |
| British | 89.4 /100 | #129 | Excellent 16.3% |
| Immigrants | Norway | 89.3 /100 | #130 | Excellent 16.3% |
| Finns | 88.3 /100 | #131 | Excellent 16.3% |
| Serbians | 88.2 /100 | #132 | Excellent 16.3% |
| Icelanders | 87.9 /100 | #133 | Excellent 16.3% |
| Immigrants | North Macedonia | 87.8 /100 | #134 | Excellent 16.4% |
| Brazilians | 87.8 /100 | #135 | Excellent 16.4% |
| Immigrants | Northern Africa | 87.5 /100 | #136 | Excellent 16.4% |
| Immigrants | Chile | 85.3 /100 | #137 | Excellent 16.4% |
| Germans | 84.8 /100 | #138 | Excellent 16.5% |
| Immigrants | Hungary | 84.5 /100 | #139 | Excellent 16.5% |
| Guamanians/Chamorros | 84.2 /100 | #140 | Excellent 16.5% |
| Immigrants | Western Europe | 83.3 /100 | #141 | Excellent 16.5% |
| Portuguese | 83.0 /100 | #142 | Excellent 16.5% |
| Samoans | 83.0 /100 | #143 | Excellent 16.5% |
Demographics Similar to Immigrants from Ukraine by Child Poverty Under the Age of 5
In terms of child poverty under the age of 5, the demographic groups most similar to Immigrants from Ukraine are Immigrants from Sweden (15.3%, a difference of 0.23%), Immigrants from Belgium (15.3%, a difference of 0.30%), Immigrants from Egypt (15.3%, a difference of 0.30%), Argentinean (15.4%, a difference of 0.36%), and Immigrants from Argentina (15.4%, a difference of 0.51%).
| Demographics | Rating | Rank | Child Poverty Under the Age of 5 |
| Immigrants | Scotland | 99.0 /100 | #66 | Exceptional 15.2% |
| Greeks | 99.0 /100 | #67 | Exceptional 15.2% |
| Zimbabweans | 99.0 /100 | #68 | Exceptional 15.2% |
| Lithuanians | 99.0 /100 | #69 | Exceptional 15.2% |
| Immigrants | Belgium | 98.8 /100 | #70 | Exceptional 15.3% |
| Immigrants | Egypt | 98.8 /100 | #71 | Exceptional 15.3% |
| Immigrants | Sweden | 98.8 /100 | #72 | Exceptional 15.3% |
| Immigrants | Ukraine | 98.7 /100 | #73 | Exceptional 15.3% |
| Argentineans | 98.5 /100 | #74 | Exceptional 15.4% |
| Immigrants | Argentina | 98.5 /100 | #75 | Exceptional 15.4% |
| Croatians | 98.5 /100 | #76 | Exceptional 15.4% |
| Immigrants | Turkey | 98.3 /100 | #77 | Exceptional 15.4% |
| Sri Lankans | 98.1 /100 | #78 | Exceptional 15.5% |
| Australians | 98.0 /100 | #79 | Exceptional 15.5% |
| Italians | 97.9 /100 | #80 | Exceptional 15.5% |