Immigrants from Albania vs Immigrants from Brazil Single Female Poverty
COMPARE
Immigrants from Albania
Immigrants from Brazil
Single Female Poverty
Single Female Poverty Comparison
Immigrants from Albania
Immigrants from Brazil
19.4%
SINGLE FEMALE POVERTY
99.2/ 100
METRIC RATING
85th/ 347
METRIC RANK
19.7%
SINGLE FEMALE POVERTY
98.2/ 100
METRIC RATING
96th/ 347
METRIC RANK
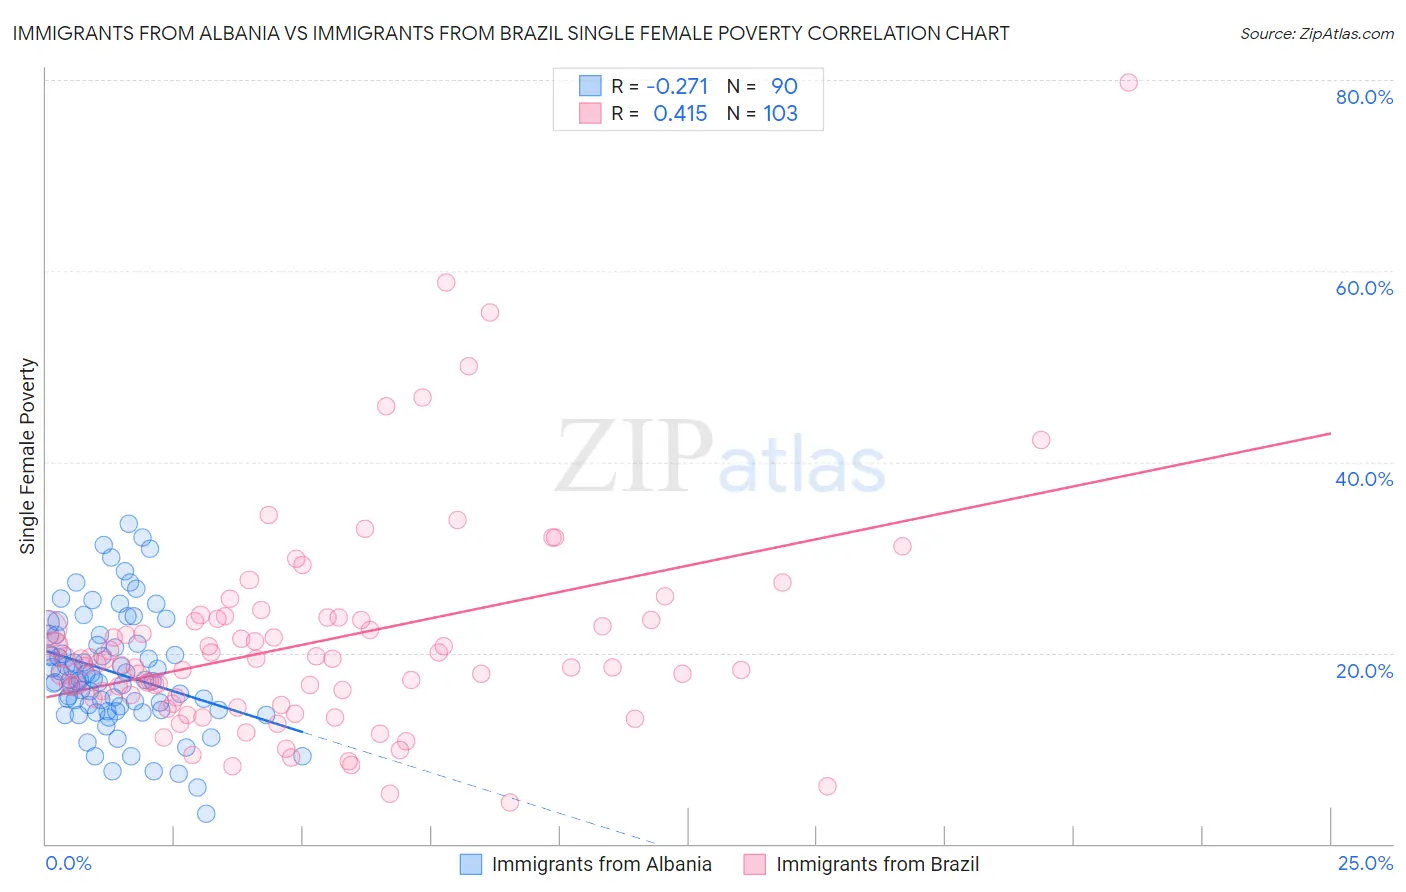
Immigrants from Albania vs Immigrants from Brazil Single Female Poverty Correlation Chart
The statistical analysis conducted on geographies consisting of 118,461,205 people shows a weak negative correlation between the proportion of Immigrants from Albania and poverty level among single females in the United States with a correlation coefficient (R) of -0.271 and weighted average of 19.4%. Similarly, the statistical analysis conducted on geographies consisting of 337,772,846 people shows a moderate positive correlation between the proportion of Immigrants from Brazil and poverty level among single females in the United States with a correlation coefficient (R) of 0.415 and weighted average of 19.7%, a difference of 1.3%.
Single Female Poverty Correlation Summary
| Measurement | Immigrants from Albania | Immigrants from Brazil |
| Minimum | 3.1% | 4.3% |
| Maximum | 33.6% | 79.7% |
| Range | 30.4% | 75.4% |
| Mean | 17.9% | 21.1% |
| Median | 17.2% | 18.8% |
| Interquartile 25% (IQ1) | 14.0% | 15.2% |
| Interquartile 75% (IQ3) | 20.9% | 23.4% |
| Interquartile Range (IQR) | 6.9% | 8.2% |
| Standard Deviation (Sample) | 6.1% | 11.3% |
| Standard Deviation (Population) | 6.0% | 11.2% |
Demographics Similar to Immigrants from Albania and Immigrants from Brazil by Single Female Poverty
In terms of single female poverty, the demographic groups most similar to Immigrants from Albania are Greek (19.4%, a difference of 0.0%), Immigrants from Sweden (19.4%, a difference of 0.040%), Taiwanese (19.4%, a difference of 0.12%), Immigrants from Malaysia (19.4%, a difference of 0.13%), and Immigrants from Scotland (19.4%, a difference of 0.14%). Similarly, the demographic groups most similar to Immigrants from Brazil are Estonian (19.7%, a difference of 0.050%), Croatian (19.7%, a difference of 0.090%), Immigrants from France (19.7%, a difference of 0.21%), Sierra Leonean (19.7%, a difference of 0.23%), and Romanian (19.6%, a difference of 0.43%).
| Demographics | Rating | Rank | Single Female Poverty |
| Immigrants | Australia | 99.3 /100 | #80 | Exceptional 19.4% |
| Immigrants | Scotland | 99.2 /100 | #81 | Exceptional 19.4% |
| Immigrants | Malaysia | 99.2 /100 | #82 | Exceptional 19.4% |
| Taiwanese | 99.2 /100 | #83 | Exceptional 19.4% |
| Immigrants | Sweden | 99.2 /100 | #84 | Exceptional 19.4% |
| Immigrants | Albania | 99.2 /100 | #85 | Exceptional 19.4% |
| Greeks | 99.2 /100 | #86 | Exceptional 19.4% |
| Zimbabweans | 99.0 /100 | #87 | Exceptional 19.5% |
| Afghans | 99.0 /100 | #88 | Exceptional 19.5% |
| Immigrants | Ukraine | 99.0 /100 | #89 | Exceptional 19.5% |
| Immigrants | Lebanon | 98.8 /100 | #90 | Exceptional 19.6% |
| Soviet Union | 98.8 /100 | #91 | Exceptional 19.6% |
| Italians | 98.8 /100 | #92 | Exceptional 19.6% |
| Immigrants | Austria | 98.8 /100 | #93 | Exceptional 19.6% |
| Romanians | 98.6 /100 | #94 | Exceptional 19.6% |
| Estonians | 98.2 /100 | #95 | Exceptional 19.7% |
| Immigrants | Brazil | 98.2 /100 | #96 | Exceptional 19.7% |
| Croatians | 98.1 /100 | #97 | Exceptional 19.7% |
| Immigrants | France | 97.9 /100 | #98 | Exceptional 19.7% |
| Sierra Leoneans | 97.9 /100 | #99 | Exceptional 19.7% |
| Ukrainians | 97.6 /100 | #100 | Exceptional 19.8% |