Immigrants from Albania vs Immigrants from North America Single Female Poverty
COMPARE
Immigrants from Albania
Immigrants from North America
Single Female Poverty
Single Female Poverty Comparison
Immigrants from Albania
Immigrants from North America
19.4%
SINGLE FEMALE POVERTY
99.2/ 100
METRIC RATING
85th/ 347
METRIC RANK
20.3%
SINGLE FEMALE POVERTY
89.5/ 100
METRIC RATING
141st/ 347
METRIC RANK
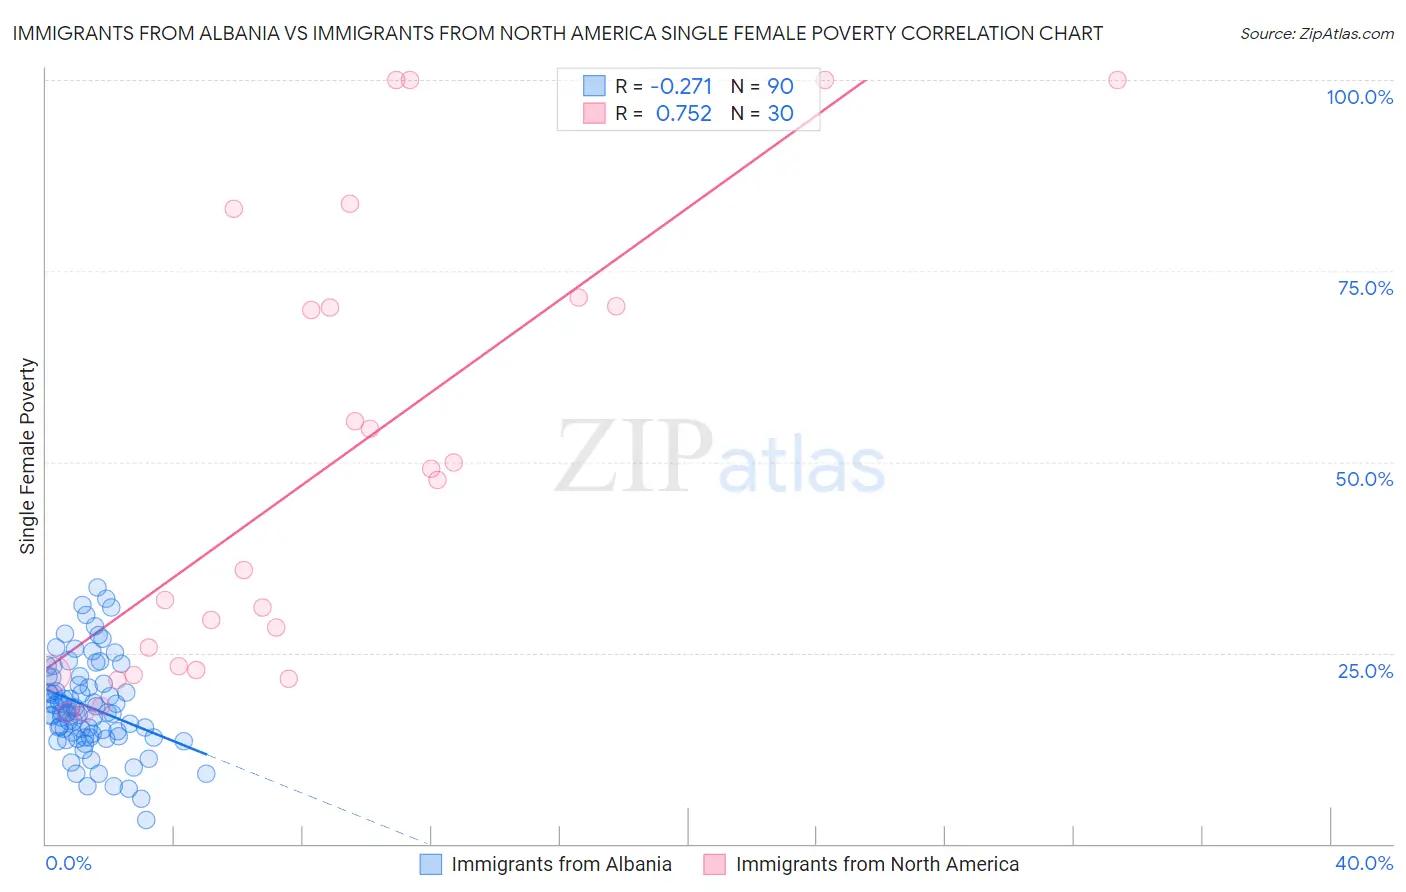
Immigrants from Albania vs Immigrants from North America Single Female Poverty Correlation Chart
The statistical analysis conducted on geographies consisting of 118,461,205 people shows a weak negative correlation between the proportion of Immigrants from Albania and poverty level among single females in the United States with a correlation coefficient (R) of -0.271 and weighted average of 19.4%. Similarly, the statistical analysis conducted on geographies consisting of 451,673,972 people shows a strong positive correlation between the proportion of Immigrants from North America and poverty level among single females in the United States with a correlation coefficient (R) of 0.752 and weighted average of 20.3%, a difference of 4.4%.
Single Female Poverty Correlation Summary
| Measurement | Immigrants from Albania | Immigrants from North America |
| Minimum | 3.1% | 17.0% |
| Maximum | 33.6% | 100.0% |
| Range | 30.4% | 83.0% |
| Mean | 17.9% | 49.1% |
| Median | 17.2% | 41.8% |
| Interquartile 25% (IQ1) | 14.0% | 22.7% |
| Interquartile 75% (IQ3) | 20.9% | 70.4% |
| Interquartile Range (IQR) | 6.9% | 47.6% |
| Standard Deviation (Sample) | 6.1% | 28.9% |
| Standard Deviation (Population) | 6.0% | 28.4% |
Similar Demographics by Single Female Poverty
Demographics Similar to Immigrants from Albania by Single Female Poverty
In terms of single female poverty, the demographic groups most similar to Immigrants from Albania are Greek (19.4%, a difference of 0.0%), Immigrants from Sweden (19.4%, a difference of 0.040%), Taiwanese (19.4%, a difference of 0.12%), Immigrants from Malaysia (19.4%, a difference of 0.13%), and Immigrants from Scotland (19.4%, a difference of 0.14%).
| Demographics | Rating | Rank | Single Female Poverty |
| Albanians | 99.3 /100 | #78 | Exceptional 19.4% |
| Immigrants | Sierra Leone | 99.3 /100 | #79 | Exceptional 19.4% |
| Immigrants | Australia | 99.3 /100 | #80 | Exceptional 19.4% |
| Immigrants | Scotland | 99.2 /100 | #81 | Exceptional 19.4% |
| Immigrants | Malaysia | 99.2 /100 | #82 | Exceptional 19.4% |
| Taiwanese | 99.2 /100 | #83 | Exceptional 19.4% |
| Immigrants | Sweden | 99.2 /100 | #84 | Exceptional 19.4% |
| Immigrants | Albania | 99.2 /100 | #85 | Exceptional 19.4% |
| Greeks | 99.2 /100 | #86 | Exceptional 19.4% |
| Zimbabweans | 99.0 /100 | #87 | Exceptional 19.5% |
| Afghans | 99.0 /100 | #88 | Exceptional 19.5% |
| Immigrants | Ukraine | 99.0 /100 | #89 | Exceptional 19.5% |
| Immigrants | Lebanon | 98.8 /100 | #90 | Exceptional 19.6% |
| Soviet Union | 98.8 /100 | #91 | Exceptional 19.6% |
| Italians | 98.8 /100 | #92 | Exceptional 19.6% |
Demographics Similar to Immigrants from North America by Single Female Poverty
In terms of single female poverty, the demographic groups most similar to Immigrants from North America are Immigrants from Uganda (20.3%, a difference of 0.080%), Syrian (20.3%, a difference of 0.15%), Slovene (20.3%, a difference of 0.16%), Immigrants from Kuwait (20.3%, a difference of 0.16%), and Australian (20.3%, a difference of 0.19%).
| Demographics | Rating | Rank | Single Female Poverty |
| Immigrants | Venezuela | 91.5 /100 | #134 | Exceptional 20.2% |
| Immigrants | Iraq | 91.2 /100 | #135 | Exceptional 20.2% |
| Immigrants | Canada | 91.2 /100 | #136 | Exceptional 20.2% |
| Immigrants | Nepal | 90.6 /100 | #137 | Exceptional 20.3% |
| Slovenes | 90.5 /100 | #138 | Exceptional 20.3% |
| Immigrants | Kuwait | 90.4 /100 | #139 | Exceptional 20.3% |
| Syrians | 90.4 /100 | #140 | Exceptional 20.3% |
| Immigrants | North America | 89.5 /100 | #141 | Excellent 20.3% |
| Immigrants | Uganda | 89.1 /100 | #142 | Excellent 20.3% |
| Australians | 88.4 /100 | #143 | Excellent 20.3% |
| Immigrants | Uzbekistan | 88.3 /100 | #144 | Excellent 20.3% |
| Austrians | 85.8 /100 | #145 | Excellent 20.4% |
| Venezuelans | 85.5 /100 | #146 | Excellent 20.4% |
| South Africans | 85.3 /100 | #147 | Excellent 20.4% |
| Luxembourgers | 84.9 /100 | #148 | Excellent 20.4% |