Immigrants from Afghanistan vs Immigrants from Eastern Africa Family Poverty
COMPARE
Immigrants from Afghanistan
Immigrants from Eastern Africa
Family Poverty
Family Poverty Comparison
Immigrants from Afghanistan
Immigrants from Eastern Africa
9.2%
FAMILY POVERTY
32.1/ 100
METRIC RATING
189th/ 347
METRIC RANK
9.5%
FAMILY POVERTY
15.1/ 100
METRIC RATING
208th/ 347
METRIC RANK
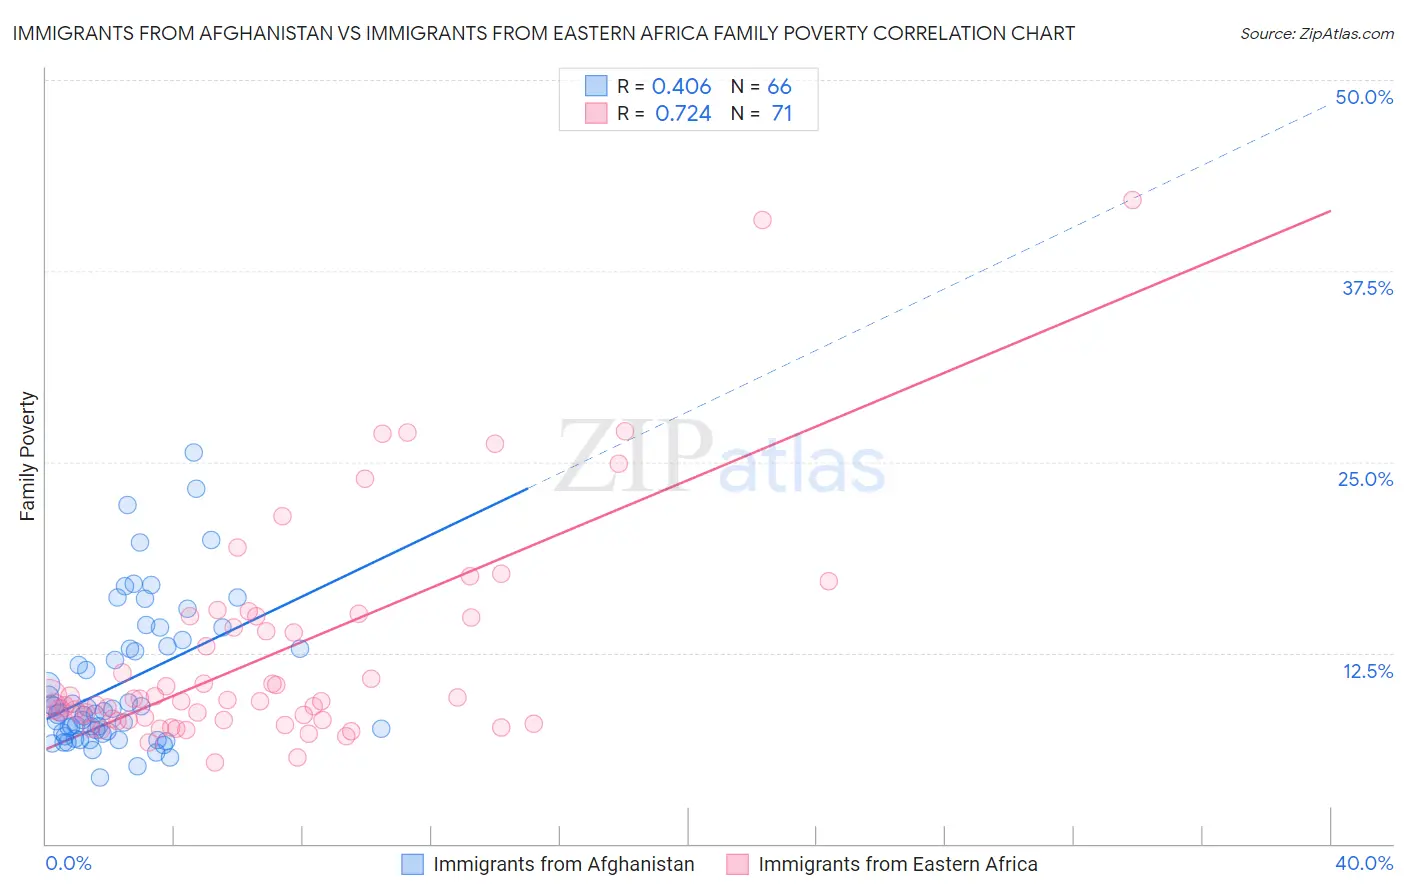
Immigrants from Afghanistan vs Immigrants from Eastern Africa Family Poverty Correlation Chart
The statistical analysis conducted on geographies consisting of 147,487,715 people shows a moderate positive correlation between the proportion of Immigrants from Afghanistan and poverty level among families in the United States with a correlation coefficient (R) of 0.406 and weighted average of 9.2%. Similarly, the statistical analysis conducted on geographies consisting of 354,301,294 people shows a strong positive correlation between the proportion of Immigrants from Eastern Africa and poverty level among families in the United States with a correlation coefficient (R) of 0.724 and weighted average of 9.5%, a difference of 3.1%.
Family Poverty Correlation Summary
| Measurement | Immigrants from Afghanistan | Immigrants from Eastern Africa |
| Minimum | 4.3% | 5.3% |
| Maximum | 25.6% | 42.2% |
| Range | 21.3% | 36.8% |
| Mean | 10.5% | 12.5% |
| Median | 8.6% | 9.4% |
| Interquartile 25% (IQ1) | 7.2% | 8.1% |
| Interquartile 75% (IQ3) | 12.9% | 14.9% |
| Interquartile Range (IQR) | 5.7% | 6.7% |
| Standard Deviation (Sample) | 4.7% | 7.4% |
| Standard Deviation (Population) | 4.7% | 7.4% |
Demographics Similar to Immigrants from Afghanistan and Immigrants from Eastern Africa by Family Poverty
In terms of family poverty, the demographic groups most similar to Immigrants from Afghanistan are Arab (9.2%, a difference of 0.090%), Immigrants from Kenya (9.2%, a difference of 0.29%), Ugandan (9.3%, a difference of 0.50%), Spanish (9.3%, a difference of 0.51%), and Immigrants from Western Asia (9.3%, a difference of 0.59%). Similarly, the demographic groups most similar to Immigrants from Eastern Africa are Sierra Leonean (9.5%, a difference of 0.11%), Immigrants from South America (9.5%, a difference of 0.64%), Aleut (9.5%, a difference of 0.65%), Immigrants from Lebanon (9.4%, a difference of 0.84%), and German Russian (9.4%, a difference of 0.94%).
| Demographics | Rating | Rank | Family Poverty |
| Immigrants | Kenya | 34.0 /100 | #188 | Fair 9.2% |
| Immigrants | Afghanistan | 32.1 /100 | #189 | Fair 9.2% |
| Arabs | 31.5 /100 | #190 | Fair 9.2% |
| Ugandans | 28.7 /100 | #191 | Fair 9.3% |
| Spanish | 28.7 /100 | #192 | Fair 9.3% |
| Immigrants | Western Asia | 28.2 /100 | #193 | Fair 9.3% |
| South Americans | 28.1 /100 | #194 | Fair 9.3% |
| Venezuelans | 27.4 /100 | #195 | Fair 9.3% |
| Immigrants | Venezuela | 26.1 /100 | #196 | Fair 9.3% |
| Immigrants | Colombia | 24.4 /100 | #197 | Fair 9.3% |
| Iraqis | 24.2 /100 | #198 | Fair 9.3% |
| Spaniards | 22.8 /100 | #199 | Fair 9.4% |
| Immigrants | Costa Rica | 21.7 /100 | #200 | Fair 9.4% |
| Immigrants | Portugal | 20.5 /100 | #201 | Fair 9.4% |
| Immigrants | Sierra Leone | 19.6 /100 | #202 | Poor 9.4% |
| German Russians | 19.4 /100 | #203 | Poor 9.4% |
| Immigrants | Lebanon | 18.9 /100 | #204 | Poor 9.4% |
| Aleuts | 18.0 /100 | #205 | Poor 9.5% |
| Immigrants | South America | 18.0 /100 | #206 | Poor 9.5% |
| Sierra Leoneans | 15.6 /100 | #207 | Poor 9.5% |
| Immigrants | Eastern Africa | 15.1 /100 | #208 | Poor 9.5% |