Immigrants from Afghanistan vs Bermudan Family Poverty
COMPARE
Immigrants from Afghanistan
Bermudan
Family Poverty
Family Poverty Comparison
Immigrants from Afghanistan
Bermudans
9.2%
FAMILY POVERTY
32.1/ 100
METRIC RATING
189th/ 347
METRIC RANK
9.9%
FAMILY POVERTY
5.3/ 100
METRIC RATING
220th/ 347
METRIC RANK
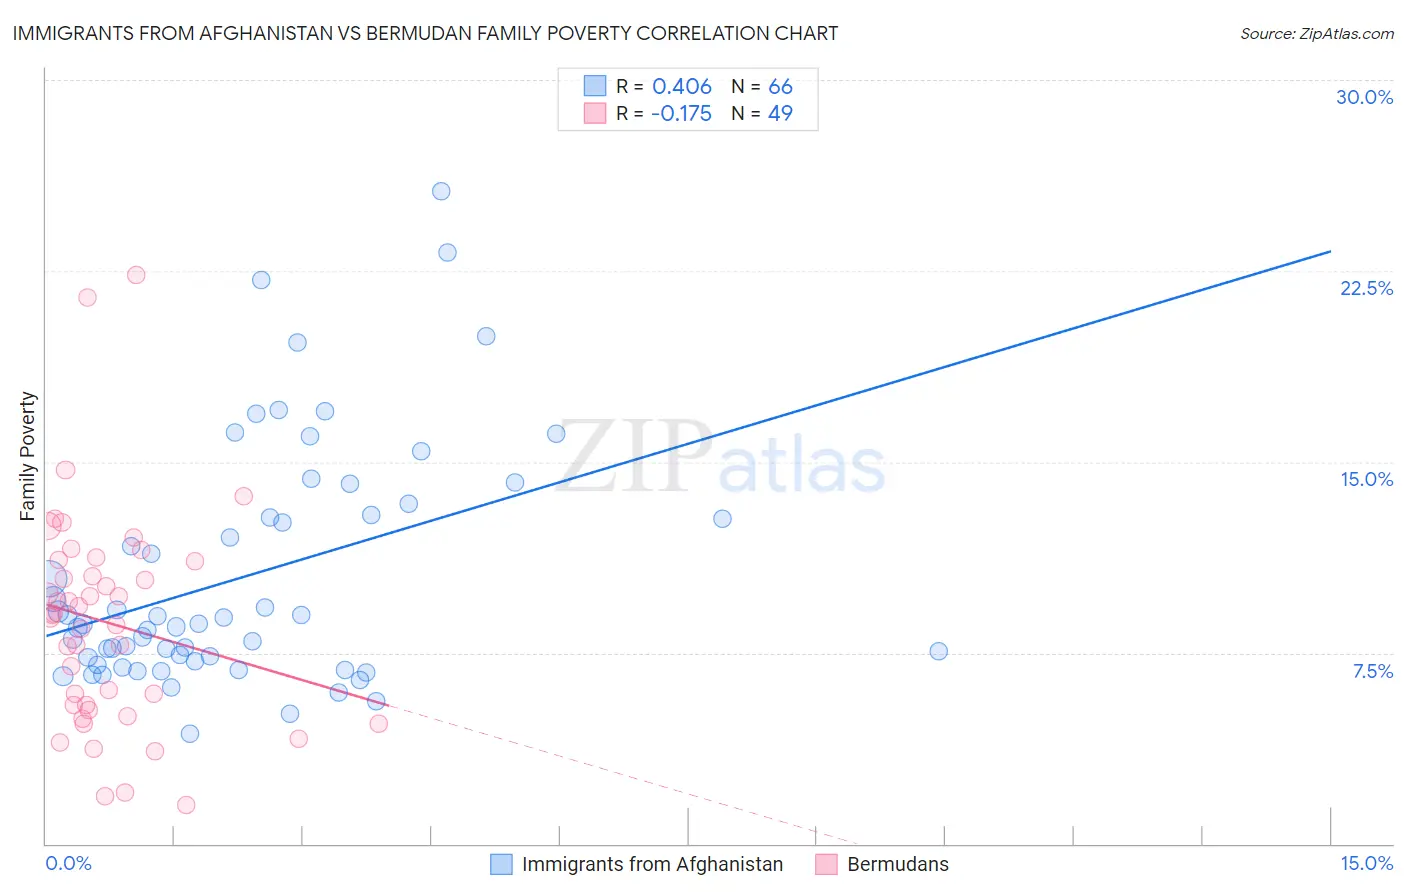
Immigrants from Afghanistan vs Bermudan Family Poverty Correlation Chart
The statistical analysis conducted on geographies consisting of 147,487,715 people shows a moderate positive correlation between the proportion of Immigrants from Afghanistan and poverty level among families in the United States with a correlation coefficient (R) of 0.406 and weighted average of 9.2%. Similarly, the statistical analysis conducted on geographies consisting of 55,709,742 people shows a poor negative correlation between the proportion of Bermudans and poverty level among families in the United States with a correlation coefficient (R) of -0.175 and weighted average of 9.9%, a difference of 6.8%.
Family Poverty Correlation Summary
| Measurement | Immigrants from Afghanistan | Bermudan |
| Minimum | 4.3% | 1.5% |
| Maximum | 25.6% | 22.4% |
| Range | 21.3% | 20.8% |
| Mean | 10.5% | 8.7% |
| Median | 8.6% | 9.0% |
| Interquartile 25% (IQ1) | 7.2% | 5.3% |
| Interquartile 75% (IQ3) | 12.9% | 11.1% |
| Interquartile Range (IQR) | 5.7% | 5.8% |
| Standard Deviation (Sample) | 4.7% | 4.3% |
| Standard Deviation (Population) | 4.7% | 4.2% |
Similar Demographics by Family Poverty
Demographics Similar to Immigrants from Afghanistan by Family Poverty
In terms of family poverty, the demographic groups most similar to Immigrants from Afghanistan are Arab (9.2%, a difference of 0.090%), Immigrants from Kenya (9.2%, a difference of 0.29%), Delaware (9.2%, a difference of 0.48%), Ugandan (9.3%, a difference of 0.50%), and Spanish (9.3%, a difference of 0.51%).
| Demographics | Rating | Rank | Family Poverty |
| Immigrants | Morocco | 40.2 /100 | #182 | Average 9.1% |
| Uruguayans | 39.2 /100 | #183 | Fair 9.1% |
| South American Indians | 38.7 /100 | #184 | Fair 9.1% |
| Immigrants | Saudi Arabia | 38.6 /100 | #185 | Fair 9.1% |
| Colombians | 36.1 /100 | #186 | Fair 9.2% |
| Delaware | 35.4 /100 | #187 | Fair 9.2% |
| Immigrants | Kenya | 34.0 /100 | #188 | Fair 9.2% |
| Immigrants | Afghanistan | 32.1 /100 | #189 | Fair 9.2% |
| Arabs | 31.5 /100 | #190 | Fair 9.2% |
| Ugandans | 28.7 /100 | #191 | Fair 9.3% |
| Spanish | 28.7 /100 | #192 | Fair 9.3% |
| Immigrants | Western Asia | 28.2 /100 | #193 | Fair 9.3% |
| South Americans | 28.1 /100 | #194 | Fair 9.3% |
| Venezuelans | 27.4 /100 | #195 | Fair 9.3% |
| Immigrants | Venezuela | 26.1 /100 | #196 | Fair 9.3% |
Demographics Similar to Bermudans by Family Poverty
In terms of family poverty, the demographic groups most similar to Bermudans are Immigrants from Eritrea (9.9%, a difference of 0.060%), Panamanian (9.8%, a difference of 0.18%), Immigrants from Cambodia (9.9%, a difference of 0.27%), Japanese (9.9%, a difference of 0.31%), and American (9.8%, a difference of 0.50%).
| Demographics | Rating | Rank | Family Poverty |
| Osage | 8.0 /100 | #213 | Tragic 9.7% |
| Immigrants | Micronesia | 6.7 /100 | #214 | Tragic 9.8% |
| Immigrants | Nonimmigrants | 6.7 /100 | #215 | Tragic 9.8% |
| Moroccans | 6.5 /100 | #216 | Tragic 9.8% |
| Americans | 6.2 /100 | #217 | Tragic 9.8% |
| Panamanians | 5.6 /100 | #218 | Tragic 9.8% |
| Immigrants | Eritrea | 5.4 /100 | #219 | Tragic 9.9% |
| Bermudans | 5.3 /100 | #220 | Tragic 9.9% |
| Immigrants | Cambodia | 4.8 /100 | #221 | Tragic 9.9% |
| Japanese | 4.8 /100 | #222 | Tragic 9.9% |
| Immigrants | Africa | 4.3 /100 | #223 | Tragic 9.9% |
| Marshallese | 3.9 /100 | #224 | Tragic 9.9% |
| Immigrants | Immigrants | 3.6 /100 | #225 | Tragic 10.0% |
| Ottawa | 3.3 /100 | #226 | Tragic 10.0% |
| Immigrants | Armenia | 3.3 /100 | #227 | Tragic 10.0% |