Immigrants from Afghanistan vs Immigrants from Chile Family Poverty
COMPARE
Immigrants from Afghanistan
Immigrants from Chile
Family Poverty
Family Poverty Comparison
Immigrants from Afghanistan
Immigrants from Chile
9.2%
FAMILY POVERTY
32.1/ 100
METRIC RATING
189th/ 347
METRIC RANK
8.9%
FAMILY POVERTY
59.6/ 100
METRIC RATING
169th/ 347
METRIC RANK
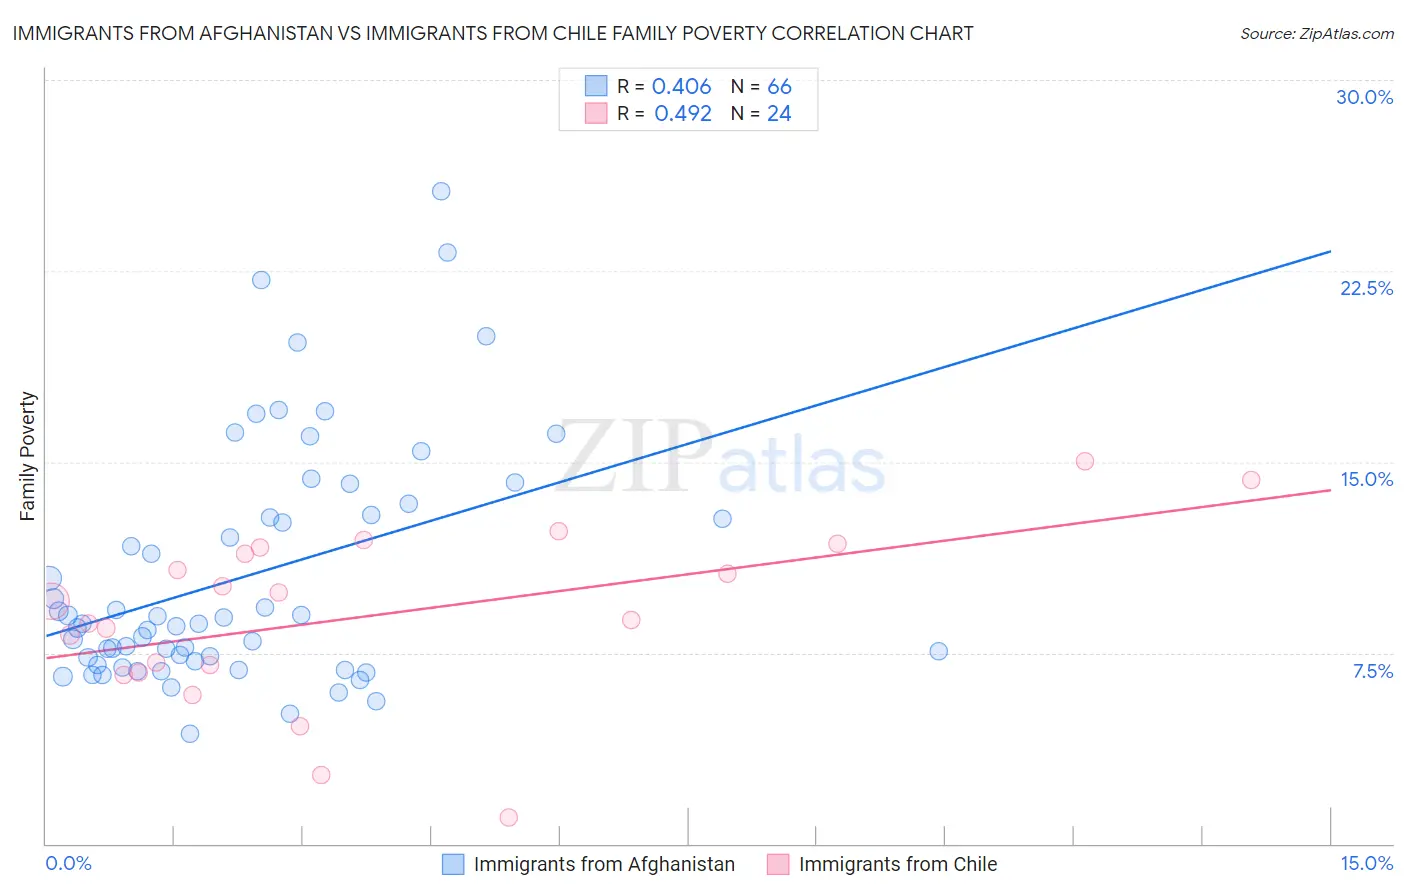
Immigrants from Afghanistan vs Immigrants from Chile Family Poverty Correlation Chart
The statistical analysis conducted on geographies consisting of 147,487,715 people shows a moderate positive correlation between the proportion of Immigrants from Afghanistan and poverty level among families in the United States with a correlation coefficient (R) of 0.406 and weighted average of 9.2%. Similarly, the statistical analysis conducted on geographies consisting of 218,435,761 people shows a moderate positive correlation between the proportion of Immigrants from Chile and poverty level among families in the United States with a correlation coefficient (R) of 0.492 and weighted average of 8.9%, a difference of 3.8%.
Family Poverty Correlation Summary
| Measurement | Immigrants from Afghanistan | Immigrants from Chile |
| Minimum | 4.3% | 1.0% |
| Maximum | 25.6% | 15.0% |
| Range | 21.3% | 14.0% |
| Mean | 10.5% | 9.0% |
| Median | 8.6% | 9.2% |
| Interquartile 25% (IQ1) | 7.2% | 6.9% |
| Interquartile 75% (IQ3) | 12.9% | 11.5% |
| Interquartile Range (IQR) | 5.7% | 4.6% |
| Standard Deviation (Sample) | 4.7% | 3.4% |
| Standard Deviation (Population) | 4.7% | 3.3% |
Demographics Similar to Immigrants from Afghanistan and Immigrants from Chile by Family Poverty
In terms of family poverty, the demographic groups most similar to Immigrants from Afghanistan are Immigrants from Kenya (9.2%, a difference of 0.29%), Delaware (9.2%, a difference of 0.48%), Colombian (9.2%, a difference of 0.57%), Immigrants from Saudi Arabia (9.1%, a difference of 0.92%), and South American Indian (9.1%, a difference of 0.94%). Similarly, the demographic groups most similar to Immigrants from Chile are Kenyan (8.9%, a difference of 0.19%), Lebanese (8.9%, a difference of 0.27%), Immigrants from Peru (8.9%, a difference of 0.29%), Immigrants from Fiji (8.9%, a difference of 0.44%), and Immigrants from Albania (9.0%, a difference of 1.3%).
| Demographics | Rating | Rank | Family Poverty |
| Immigrants | Chile | 59.6 /100 | #169 | Average 8.9% |
| Kenyans | 58.2 /100 | #170 | Average 8.9% |
| Lebanese | 57.6 /100 | #171 | Average 8.9% |
| Immigrants | Peru | 57.5 /100 | #172 | Average 8.9% |
| Immigrants | Fiji | 56.4 /100 | #173 | Average 8.9% |
| Immigrants | Albania | 50.0 /100 | #174 | Average 9.0% |
| Costa Ricans | 49.3 /100 | #175 | Average 9.0% |
| Immigrants | Syria | 47.5 /100 | #176 | Average 9.0% |
| Hawaiians | 47.2 /100 | #177 | Average 9.0% |
| Immigrants | Cameroon | 47.1 /100 | #178 | Average 9.0% |
| Immigrants | Iraq | 44.4 /100 | #179 | Average 9.1% |
| Immigrants | Uganda | 43.4 /100 | #180 | Average 9.1% |
| Hmong | 40.2 /100 | #181 | Average 9.1% |
| Immigrants | Morocco | 40.2 /100 | #182 | Average 9.1% |
| Uruguayans | 39.2 /100 | #183 | Fair 9.1% |
| South American Indians | 38.7 /100 | #184 | Fair 9.1% |
| Immigrants | Saudi Arabia | 38.6 /100 | #185 | Fair 9.1% |
| Colombians | 36.1 /100 | #186 | Fair 9.2% |
| Delaware | 35.4 /100 | #187 | Fair 9.2% |
| Immigrants | Kenya | 34.0 /100 | #188 | Fair 9.2% |
| Immigrants | Afghanistan | 32.1 /100 | #189 | Fair 9.2% |