Icelander vs Immigrants from Sudan Poverty
COMPARE
Icelander
Immigrants from Sudan
Poverty
Poverty Comparison
Icelanders
Immigrants from Sudan
11.9%
POVERTY
77.9/ 100
METRIC RATING
144th/ 347
METRIC RANK
14.1%
POVERTY
0.3/ 100
METRIC RATING
245th/ 347
METRIC RANK
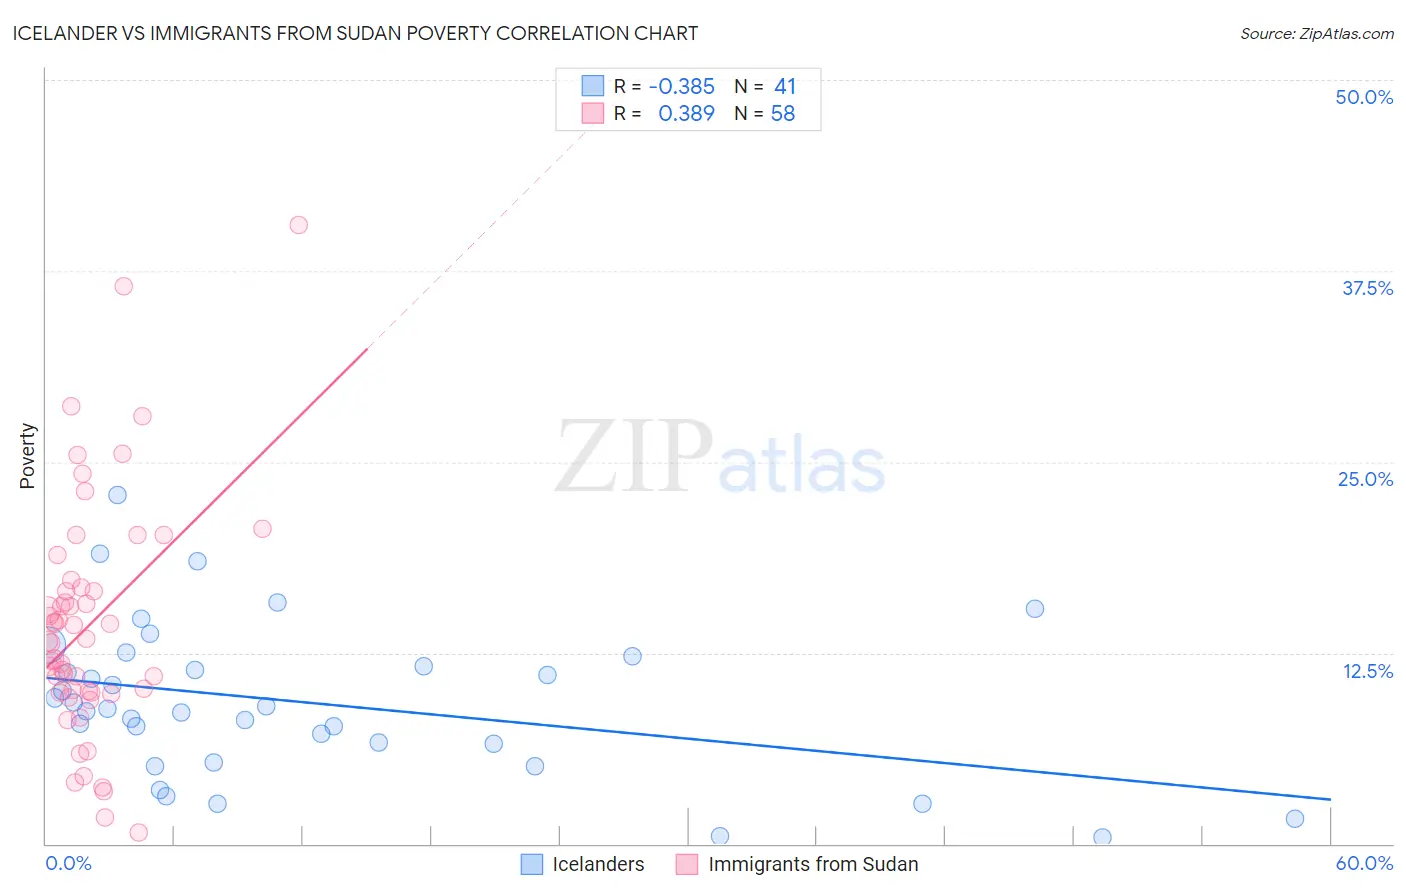
Icelander vs Immigrants from Sudan Poverty Correlation Chart
The statistical analysis conducted on geographies consisting of 159,621,690 people shows a mild negative correlation between the proportion of Icelanders and poverty level in the United States with a correlation coefficient (R) of -0.385 and weighted average of 11.9%. Similarly, the statistical analysis conducted on geographies consisting of 118,962,035 people shows a mild positive correlation between the proportion of Immigrants from Sudan and poverty level in the United States with a correlation coefficient (R) of 0.389 and weighted average of 14.1%, a difference of 17.8%.
Poverty Correlation Summary
| Measurement | Icelander | Immigrants from Sudan |
| Minimum | 0.44% | 0.75% |
| Maximum | 22.8% | 40.5% |
| Range | 22.4% | 39.8% |
| Mean | 9.2% | 14.3% |
| Median | 8.9% | 13.4% |
| Interquartile 25% (IQ1) | 5.9% | 9.9% |
| Interquartile 75% (IQ3) | 12.0% | 16.8% |
| Interquartile Range (IQR) | 6.0% | 6.9% |
| Standard Deviation (Sample) | 5.0% | 7.8% |
| Standard Deviation (Population) | 4.9% | 7.7% |
Similar Demographics by Poverty
Demographics Similar to Icelanders by Poverty
In terms of poverty, the demographic groups most similar to Icelanders are Brazilian (11.9%, a difference of 0.27%), Basque (11.9%, a difference of 0.38%), Syrian (12.0%, a difference of 0.38%), Immigrants from France (11.9%, a difference of 0.40%), and Afghan (12.0%, a difference of 0.42%).
| Demographics | Rating | Rank | Poverty |
| Immigrants | Switzerland | 83.0 /100 | #137 | Excellent 11.8% |
| Immigrants | Jordan | 82.4 /100 | #138 | Excellent 11.9% |
| Pakistanis | 82.2 /100 | #139 | Excellent 11.9% |
| Immigrants | Peru | 81.1 /100 | #140 | Excellent 11.9% |
| Immigrants | France | 80.5 /100 | #141 | Excellent 11.9% |
| Basques | 80.4 /100 | #142 | Excellent 11.9% |
| Brazilians | 79.7 /100 | #143 | Good 11.9% |
| Icelanders | 77.9 /100 | #144 | Good 11.9% |
| Syrians | 75.1 /100 | #145 | Good 12.0% |
| Afghans | 74.9 /100 | #146 | Good 12.0% |
| Immigrants | Bosnia and Herzegovina | 73.7 /100 | #147 | Good 12.0% |
| Immigrants | Germany | 72.7 /100 | #148 | Good 12.0% |
| Immigrants | Malaysia | 72.7 /100 | #149 | Good 12.0% |
| Immigrants | Kazakhstan | 72.3 /100 | #150 | Good 12.0% |
| Samoans | 71.9 /100 | #151 | Good 12.0% |
Demographics Similar to Immigrants from Sudan by Poverty
In terms of poverty, the demographic groups most similar to Immigrants from Sudan are Potawatomi (14.1%, a difference of 0.20%), Nepalese (14.0%, a difference of 0.39%), Sudanese (14.0%, a difference of 0.42%), Liberian (14.1%, a difference of 0.48%), and Ecuadorian (14.0%, a difference of 0.49%).
| Demographics | Rating | Rank | Poverty |
| Ghanaians | 0.5 /100 | #238 | Tragic 13.9% |
| Nicaraguans | 0.4 /100 | #239 | Tragic 13.9% |
| Immigrants | Middle Africa | 0.4 /100 | #240 | Tragic 14.0% |
| Salvadorans | 0.4 /100 | #241 | Tragic 14.0% |
| Ecuadorians | 0.4 /100 | #242 | Tragic 14.0% |
| Sudanese | 0.3 /100 | #243 | Tragic 14.0% |
| Nepalese | 0.3 /100 | #244 | Tragic 14.0% |
| Immigrants | Sudan | 0.3 /100 | #245 | Tragic 14.1% |
| Potawatomi | 0.3 /100 | #246 | Tragic 14.1% |
| Liberians | 0.2 /100 | #247 | Tragic 14.1% |
| Immigrants | Western Africa | 0.2 /100 | #248 | Tragic 14.1% |
| Immigrants | Ghana | 0.2 /100 | #249 | Tragic 14.2% |
| Cree | 0.2 /100 | #250 | Tragic 14.2% |
| Immigrants | Burma/Myanmar | 0.2 /100 | #251 | Tragic 14.2% |
| Spanish American Indians | 0.2 /100 | #252 | Tragic 14.2% |