Indian (Asian) vs Immigrants from Sudan Poverty
COMPARE
Indian (Asian)
Immigrants from Sudan
Poverty
Poverty Comparison
Indians (Asian)
Immigrants from Sudan
11.3%
POVERTY
96.6/ 100
METRIC RATING
80th/ 347
METRIC RANK
14.1%
POVERTY
0.3/ 100
METRIC RATING
245th/ 347
METRIC RANK
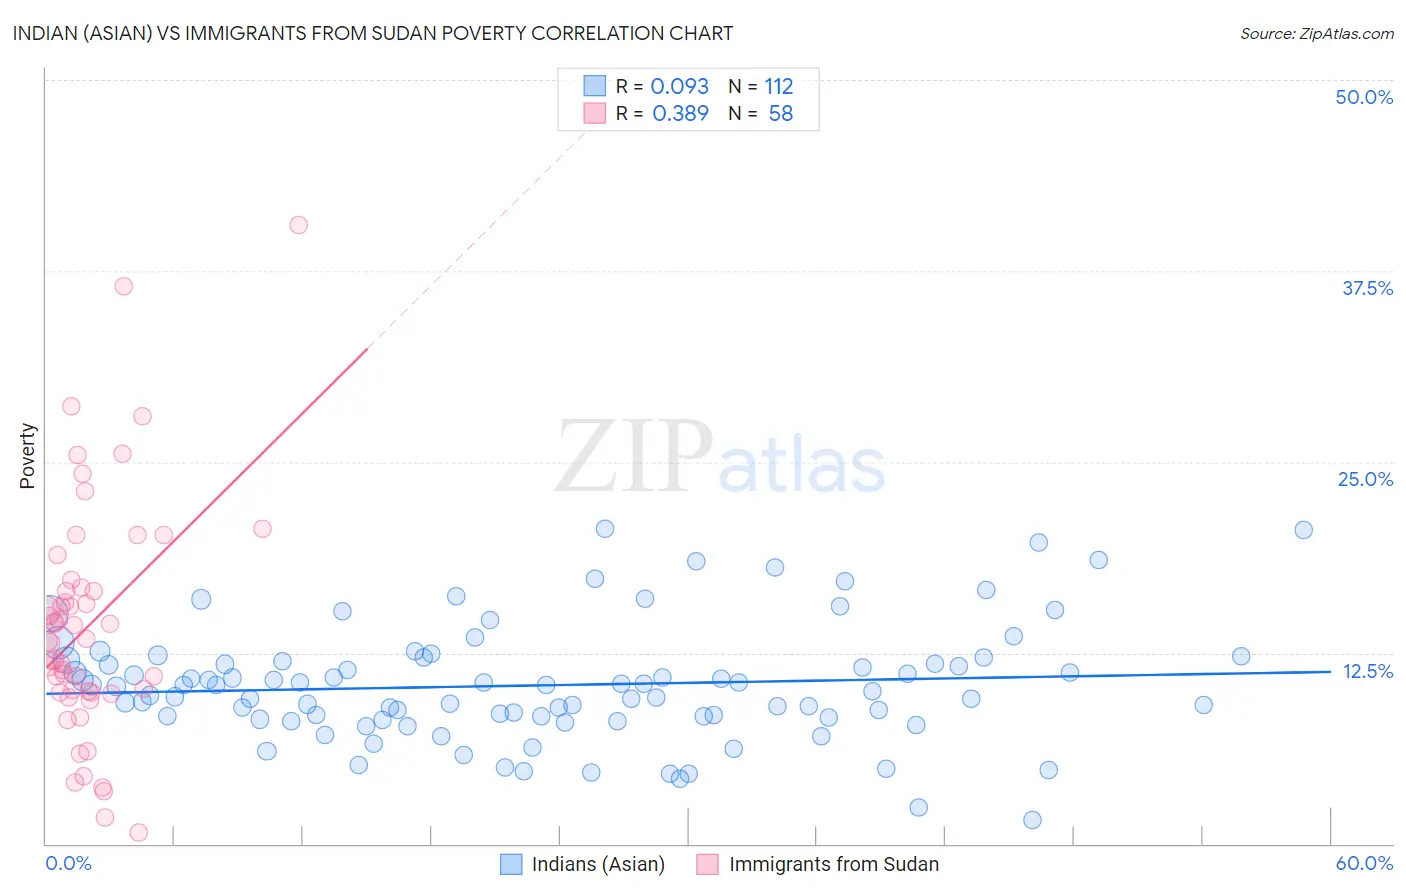
Indian (Asian) vs Immigrants from Sudan Poverty Correlation Chart
The statistical analysis conducted on geographies consisting of 494,774,105 people shows a slight positive correlation between the proportion of Indians (Asian) and poverty level in the United States with a correlation coefficient (R) of 0.093 and weighted average of 11.3%. Similarly, the statistical analysis conducted on geographies consisting of 118,962,035 people shows a mild positive correlation between the proportion of Immigrants from Sudan and poverty level in the United States with a correlation coefficient (R) of 0.389 and weighted average of 14.1%, a difference of 24.4%.
Poverty Correlation Summary
| Measurement | Indian (Asian) | Immigrants from Sudan |
| Minimum | 1.6% | 0.75% |
| Maximum | 20.6% | 40.5% |
| Range | 19.0% | 39.8% |
| Mean | 10.4% | 14.3% |
| Median | 10.3% | 13.4% |
| Interquartile 25% (IQ1) | 8.3% | 9.9% |
| Interquartile 75% (IQ3) | 12.0% | 16.8% |
| Interquartile Range (IQR) | 3.7% | 6.9% |
| Standard Deviation (Sample) | 3.8% | 7.8% |
| Standard Deviation (Population) | 3.7% | 7.7% |
Similar Demographics by Poverty
Demographics Similar to Indians (Asian) by Poverty
In terms of poverty, the demographic groups most similar to Indians (Asian) are Irish (11.3%, a difference of 0.0%), Cambodian (11.3%, a difference of 0.020%), Dutch (11.3%, a difference of 0.060%), Immigrants from Eastern Asia (11.3%, a difference of 0.080%), and Egyptian (11.3%, a difference of 0.10%).
| Demographics | Rating | Rank | Poverty |
| Immigrants | Belgium | 97.2 /100 | #73 | Exceptional 11.3% |
| Carpatho Rusyns | 97.2 /100 | #74 | Exceptional 11.3% |
| Immigrants | Eastern Europe | 97.0 /100 | #75 | Exceptional 11.3% |
| Immigrants | North America | 96.8 /100 | #76 | Exceptional 11.3% |
| Immigrants | Eastern Asia | 96.7 /100 | #77 | Exceptional 11.3% |
| Dutch | 96.7 /100 | #78 | Exceptional 11.3% |
| Cambodians | 96.7 /100 | #79 | Exceptional 11.3% |
| Indians (Asian) | 96.6 /100 | #80 | Exceptional 11.3% |
| Irish | 96.6 /100 | #81 | Exceptional 11.3% |
| Egyptians | 96.5 /100 | #82 | Exceptional 11.3% |
| Immigrants | Sweden | 96.3 /100 | #83 | Exceptional 11.3% |
| English | 96.3 /100 | #84 | Exceptional 11.3% |
| Immigrants | England | 96.2 /100 | #85 | Exceptional 11.4% |
| Jordanians | 96.0 /100 | #86 | Exceptional 11.4% |
| Northern Europeans | 96.0 /100 | #87 | Exceptional 11.4% |
Demographics Similar to Immigrants from Sudan by Poverty
In terms of poverty, the demographic groups most similar to Immigrants from Sudan are Potawatomi (14.1%, a difference of 0.20%), Nepalese (14.0%, a difference of 0.39%), Sudanese (14.0%, a difference of 0.42%), Liberian (14.1%, a difference of 0.48%), and Ecuadorian (14.0%, a difference of 0.49%).
| Demographics | Rating | Rank | Poverty |
| Ghanaians | 0.5 /100 | #238 | Tragic 13.9% |
| Nicaraguans | 0.4 /100 | #239 | Tragic 13.9% |
| Immigrants | Middle Africa | 0.4 /100 | #240 | Tragic 14.0% |
| Salvadorans | 0.4 /100 | #241 | Tragic 14.0% |
| Ecuadorians | 0.4 /100 | #242 | Tragic 14.0% |
| Sudanese | 0.3 /100 | #243 | Tragic 14.0% |
| Nepalese | 0.3 /100 | #244 | Tragic 14.0% |
| Immigrants | Sudan | 0.3 /100 | #245 | Tragic 14.1% |
| Potawatomi | 0.3 /100 | #246 | Tragic 14.1% |
| Liberians | 0.2 /100 | #247 | Tragic 14.1% |
| Immigrants | Western Africa | 0.2 /100 | #248 | Tragic 14.1% |
| Immigrants | Ghana | 0.2 /100 | #249 | Tragic 14.2% |
| Cree | 0.2 /100 | #250 | Tragic 14.2% |
| Immigrants | Burma/Myanmar | 0.2 /100 | #251 | Tragic 14.2% |
| Spanish American Indians | 0.2 /100 | #252 | Tragic 14.2% |