Burmese vs Immigrants from Sudan Poverty
COMPARE
Burmese
Immigrants from Sudan
Poverty
Poverty Comparison
Burmese
Immigrants from Sudan
10.7%
POVERTY
99.6/ 100
METRIC RATING
26th/ 347
METRIC RANK
14.1%
POVERTY
0.3/ 100
METRIC RATING
245th/ 347
METRIC RANK
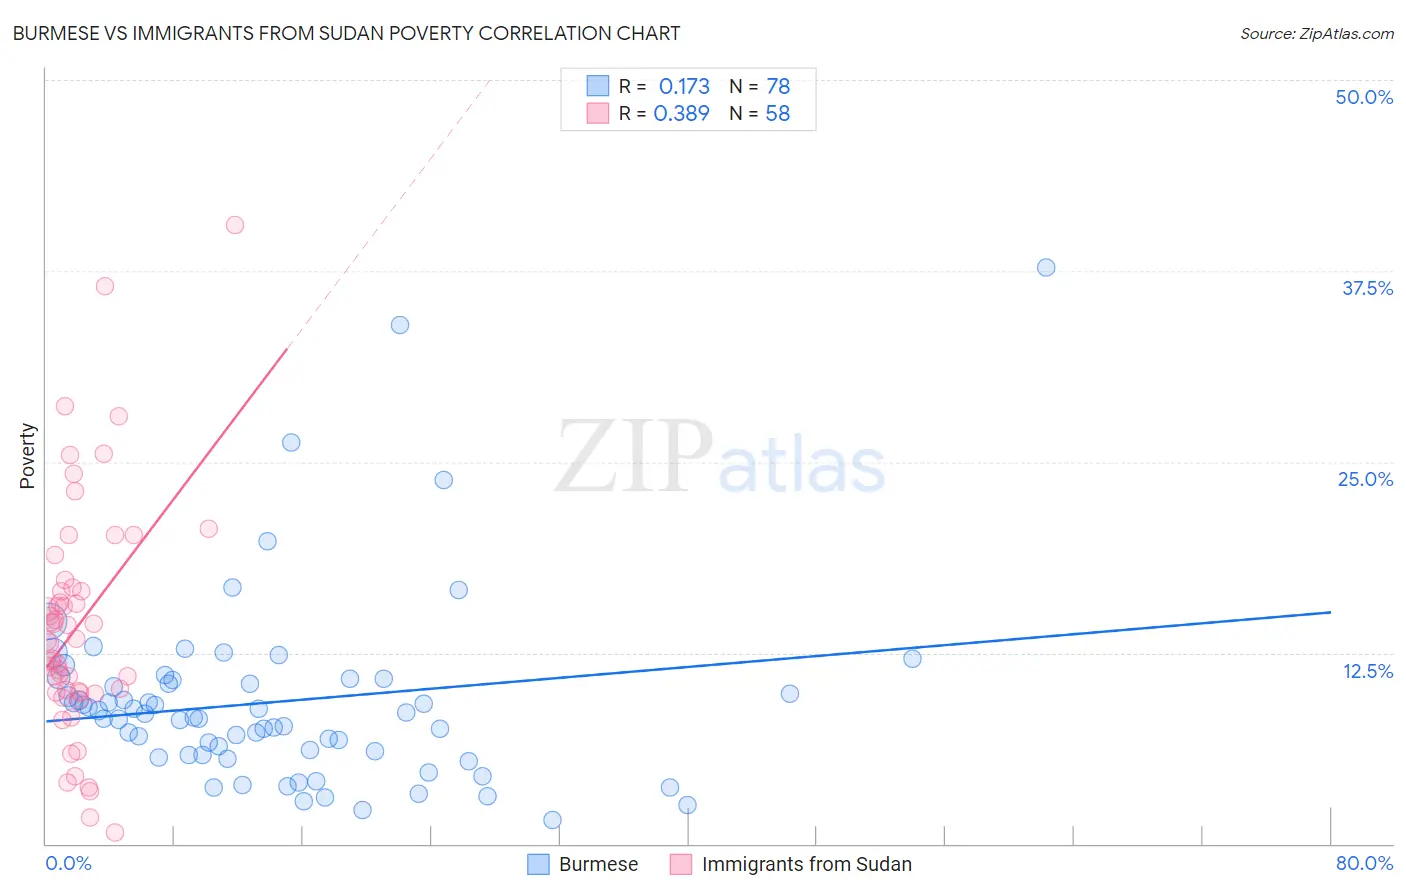
Burmese vs Immigrants from Sudan Poverty Correlation Chart
The statistical analysis conducted on geographies consisting of 464,896,901 people shows a poor positive correlation between the proportion of Burmese and poverty level in the United States with a correlation coefficient (R) of 0.173 and weighted average of 10.7%. Similarly, the statistical analysis conducted on geographies consisting of 118,962,035 people shows a mild positive correlation between the proportion of Immigrants from Sudan and poverty level in the United States with a correlation coefficient (R) of 0.389 and weighted average of 14.1%, a difference of 31.9%.
Poverty Correlation Summary
| Measurement | Burmese | Immigrants from Sudan |
| Minimum | 1.6% | 0.75% |
| Maximum | 37.7% | 40.5% |
| Range | 36.2% | 39.8% |
| Mean | 9.3% | 14.3% |
| Median | 8.4% | 13.4% |
| Interquartile 25% (IQ1) | 5.8% | 9.9% |
| Interquartile 75% (IQ3) | 10.8% | 16.8% |
| Interquartile Range (IQR) | 4.9% | 6.9% |
| Standard Deviation (Sample) | 6.2% | 7.8% |
| Standard Deviation (Population) | 6.1% | 7.7% |
Similar Demographics by Poverty
Demographics Similar to Burmese by Poverty
In terms of poverty, the demographic groups most similar to Burmese are Croatian (10.6%, a difference of 0.31%), Immigrants from Northern Europe (10.7%, a difference of 0.36%), Immigrants from Korea (10.7%, a difference of 0.42%), Italian (10.6%, a difference of 0.50%), and Greek (10.7%, a difference of 0.52%).
| Demographics | Rating | Rank | Poverty |
| Immigrants | Scotland | 99.7 /100 | #19 | Exceptional 10.6% |
| Immigrants | North Macedonia | 99.7 /100 | #20 | Exceptional 10.6% |
| Luxembourgers | 99.7 /100 | #21 | Exceptional 10.6% |
| Eastern Europeans | 99.7 /100 | #22 | Exceptional 10.6% |
| Swedes | 99.7 /100 | #23 | Exceptional 10.6% |
| Italians | 99.7 /100 | #24 | Exceptional 10.6% |
| Croatians | 99.6 /100 | #25 | Exceptional 10.6% |
| Burmese | 99.6 /100 | #26 | Exceptional 10.7% |
| Immigrants | Northern Europe | 99.6 /100 | #27 | Exceptional 10.7% |
| Immigrants | Korea | 99.5 /100 | #28 | Exceptional 10.7% |
| Greeks | 99.5 /100 | #29 | Exceptional 10.7% |
| Danes | 99.5 /100 | #30 | Exceptional 10.7% |
| Poles | 99.5 /100 | #31 | Exceptional 10.7% |
| Iranians | 99.5 /100 | #32 | Exceptional 10.7% |
| Macedonians | 99.4 /100 | #33 | Exceptional 10.8% |
Demographics Similar to Immigrants from Sudan by Poverty
In terms of poverty, the demographic groups most similar to Immigrants from Sudan are Potawatomi (14.1%, a difference of 0.20%), Nepalese (14.0%, a difference of 0.39%), Sudanese (14.0%, a difference of 0.42%), Liberian (14.1%, a difference of 0.48%), and Ecuadorian (14.0%, a difference of 0.49%).
| Demographics | Rating | Rank | Poverty |
| Ghanaians | 0.5 /100 | #238 | Tragic 13.9% |
| Nicaraguans | 0.4 /100 | #239 | Tragic 13.9% |
| Immigrants | Middle Africa | 0.4 /100 | #240 | Tragic 14.0% |
| Salvadorans | 0.4 /100 | #241 | Tragic 14.0% |
| Ecuadorians | 0.4 /100 | #242 | Tragic 14.0% |
| Sudanese | 0.3 /100 | #243 | Tragic 14.0% |
| Nepalese | 0.3 /100 | #244 | Tragic 14.0% |
| Immigrants | Sudan | 0.3 /100 | #245 | Tragic 14.1% |
| Potawatomi | 0.3 /100 | #246 | Tragic 14.1% |
| Liberians | 0.2 /100 | #247 | Tragic 14.1% |
| Immigrants | Western Africa | 0.2 /100 | #248 | Tragic 14.1% |
| Immigrants | Ghana | 0.2 /100 | #249 | Tragic 14.2% |
| Cree | 0.2 /100 | #250 | Tragic 14.2% |
| Immigrants | Burma/Myanmar | 0.2 /100 | #251 | Tragic 14.2% |
| Spanish American Indians | 0.2 /100 | #252 | Tragic 14.2% |