Icelander vs Immigrants from Guatemala Single Mother Poverty
COMPARE
Icelander
Immigrants from Guatemala
Single Mother Poverty
Single Mother Poverty Comparison
Icelanders
Immigrants from Guatemala
29.5%
SINGLE MOTHER POVERTY
26.1/ 100
METRIC RATING
194th/ 347
METRIC RANK
33.3%
SINGLE MOTHER POVERTY
0.0/ 100
METRIC RATING
299th/ 347
METRIC RANK
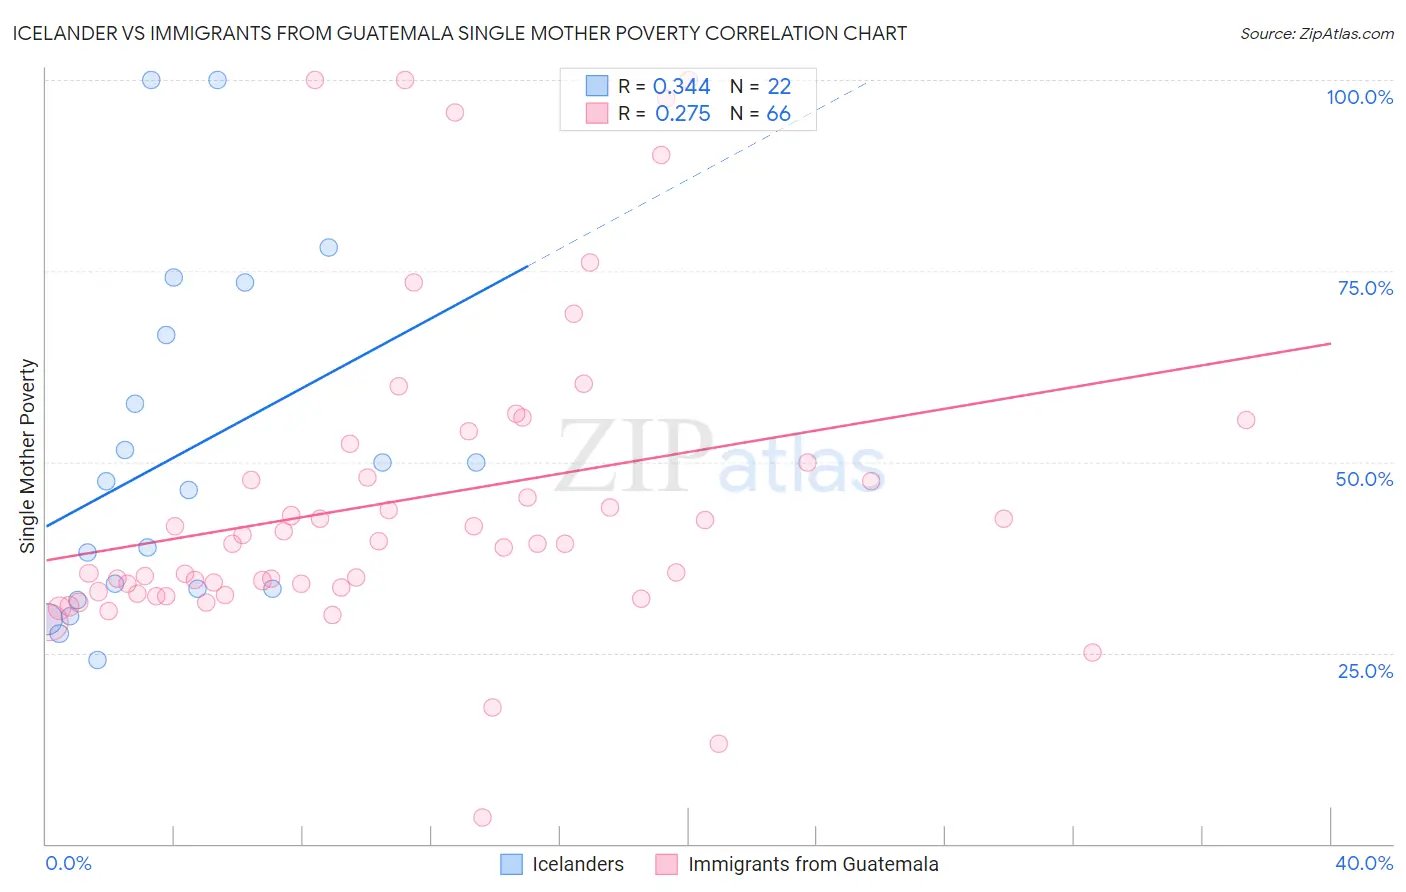
Icelander vs Immigrants from Guatemala Single Mother Poverty Correlation Chart
The statistical analysis conducted on geographies consisting of 157,541,797 people shows a mild positive correlation between the proportion of Icelanders and poverty level among single mothers in the United States with a correlation coefficient (R) of 0.344 and weighted average of 29.5%. Similarly, the statistical analysis conducted on geographies consisting of 371,171,029 people shows a weak positive correlation between the proportion of Immigrants from Guatemala and poverty level among single mothers in the United States with a correlation coefficient (R) of 0.275 and weighted average of 33.3%, a difference of 12.8%.
Single Mother Poverty Correlation Summary
| Measurement | Icelander | Immigrants from Guatemala |
| Minimum | 24.1% | 3.4% |
| Maximum | 100.0% | 100.0% |
| Range | 75.9% | 96.6% |
| Mean | 50.7% | 45.0% |
| Median | 46.9% | 39.3% |
| Interquartile 25% (IQ1) | 33.3% | 33.0% |
| Interquartile 75% (IQ3) | 66.7% | 50.0% |
| Interquartile Range (IQR) | 33.3% | 17.0% |
| Standard Deviation (Sample) | 22.6% | 20.7% |
| Standard Deviation (Population) | 22.0% | 20.5% |
Similar Demographics by Single Mother Poverty
Demographics Similar to Icelanders by Single Mother Poverty
In terms of single mother poverty, the demographic groups most similar to Icelanders are Slavic (29.6%, a difference of 0.10%), Basque (29.5%, a difference of 0.13%), Moroccan (29.5%, a difference of 0.15%), Spanish American Indian (29.6%, a difference of 0.17%), and Immigrants from Trinidad and Tobago (29.5%, a difference of 0.19%).
| Demographics | Rating | Rank | Single Mother Poverty |
| Lebanese | 32.5 /100 | #187 | Fair 29.4% |
| Guamanians/Chamorros | 31.8 /100 | #188 | Fair 29.4% |
| Immigrants | Africa | 31.6 /100 | #189 | Fair 29.4% |
| Immigrants | Germany | 30.4 /100 | #190 | Fair 29.5% |
| Immigrants | Trinidad and Tobago | 29.2 /100 | #191 | Fair 29.5% |
| Moroccans | 28.6 /100 | #192 | Fair 29.5% |
| Basques | 28.3 /100 | #193 | Fair 29.5% |
| Icelanders | 26.1 /100 | #194 | Fair 29.5% |
| Slavs | 24.5 /100 | #195 | Fair 29.6% |
| Spanish American Indians | 23.4 /100 | #196 | Fair 29.6% |
| Immigrants | Jamaica | 22.0 /100 | #197 | Fair 29.6% |
| Trinidadians and Tobagonians | 21.7 /100 | #198 | Fair 29.6% |
| Cubans | 20.8 /100 | #199 | Fair 29.6% |
| Panamanians | 20.0 /100 | #200 | Fair 29.6% |
| Belgians | 18.8 /100 | #201 | Poor 29.7% |
Demographics Similar to Immigrants from Guatemala by Single Mother Poverty
In terms of single mother poverty, the demographic groups most similar to Immigrants from Guatemala are Hispanic or Latino (33.3%, a difference of 0.0%), African (33.3%, a difference of 0.090%), Pennsylvania German (33.2%, a difference of 0.20%), Immigrants from Somalia (33.4%, a difference of 0.25%), and Blackfeet (33.2%, a difference of 0.34%).
| Demographics | Rating | Rank | Single Mother Poverty |
| Shoshone | 0.0 /100 | #292 | Tragic 32.9% |
| Aleuts | 0.0 /100 | #293 | Tragic 32.9% |
| French American Indians | 0.0 /100 | #294 | Tragic 33.1% |
| Yaqui | 0.0 /100 | #295 | Tragic 33.1% |
| Blackfeet | 0.0 /100 | #296 | Tragic 33.2% |
| Pennsylvania Germans | 0.0 /100 | #297 | Tragic 33.2% |
| Africans | 0.0 /100 | #298 | Tragic 33.3% |
| Immigrants | Guatemala | 0.0 /100 | #299 | Tragic 33.3% |
| Hispanics or Latinos | 0.0 /100 | #300 | Tragic 33.3% |
| Immigrants | Somalia | 0.0 /100 | #301 | Tragic 33.4% |
| Arapaho | 0.0 /100 | #302 | Tragic 33.4% |
| Americans | 0.0 /100 | #303 | Tragic 33.5% |
| Mexicans | 0.0 /100 | #304 | Tragic 33.6% |
| Immigrants | Central America | 0.0 /100 | #305 | Tragic 33.6% |
| Immigrants | Congo | 0.0 /100 | #306 | Tragic 33.8% |