Hungarian vs Shoshone Child Poverty Among Girls Under 16
COMPARE
Hungarian
Shoshone
Child Poverty Among Girls Under 16
Child Poverty Among Girls Under 16 Comparison
Hungarians
Shoshone
16.6%
CHILD POVERTY AMONG GIRLS UNDER 16
45.1/ 100
METRIC RATING
176th/ 347
METRIC RANK
18.9%
CHILD POVERTY AMONG GIRLS UNDER 16
0.6/ 100
METRIC RATING
245th/ 347
METRIC RANK
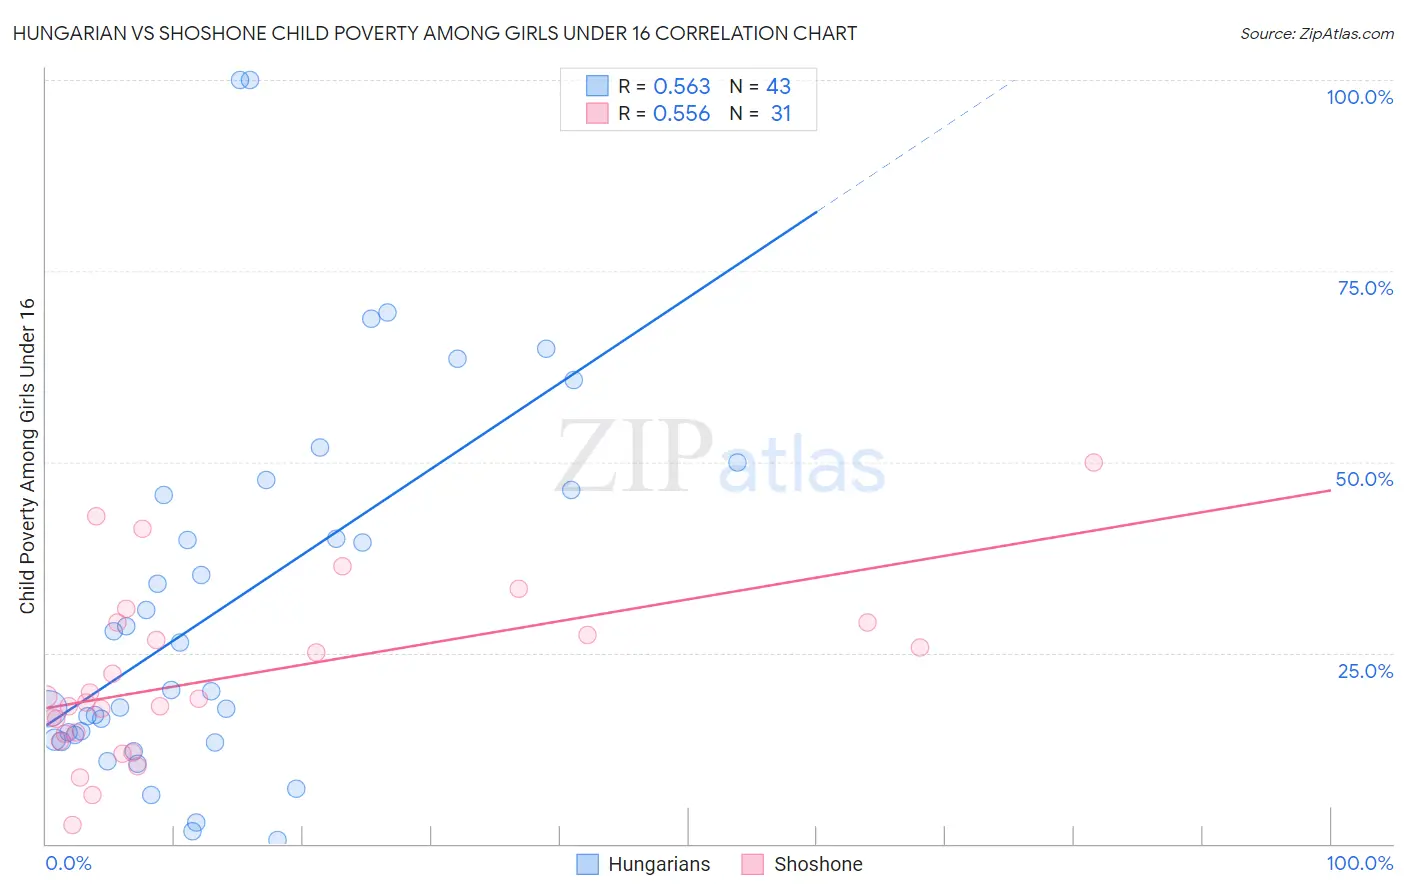
Hungarian vs Shoshone Child Poverty Among Girls Under 16 Correlation Chart
The statistical analysis conducted on geographies consisting of 471,414,008 people shows a substantial positive correlation between the proportion of Hungarians and poverty level among girls under the age of 16 in the United States with a correlation coefficient (R) of 0.563 and weighted average of 16.6%. Similarly, the statistical analysis conducted on geographies consisting of 66,320,610 people shows a substantial positive correlation between the proportion of Shoshone and poverty level among girls under the age of 16 in the United States with a correlation coefficient (R) of 0.556 and weighted average of 18.9%, a difference of 13.9%.
Child Poverty Among Girls Under 16 Correlation Summary
| Measurement | Hungarian | Shoshone |
| Minimum | 0.46% | 2.5% |
| Maximum | 100.0% | 50.0% |
| Range | 99.5% | 47.5% |
| Mean | 31.4% | 21.8% |
| Median | 20.1% | 18.9% |
| Interquartile 25% (IQ1) | 13.6% | 14.4% |
| Interquartile 75% (IQ3) | 46.3% | 29.0% |
| Interquartile Range (IQR) | 32.7% | 14.6% |
| Standard Deviation (Sample) | 24.6% | 11.0% |
| Standard Deviation (Population) | 24.3% | 10.8% |
Similar Demographics by Child Poverty Among Girls Under 16
Demographics Similar to Hungarians by Child Poverty Among Girls Under 16
In terms of child poverty among girls under 16, the demographic groups most similar to Hungarians are Lebanese (16.6%, a difference of 0.030%), Immigrants from Western Asia (16.6%, a difference of 0.11%), White/Caucasian (16.6%, a difference of 0.17%), Hawaiian (16.6%, a difference of 0.20%), and Immigrants from Syria (16.6%, a difference of 0.21%).
| Demographics | Rating | Rank | Child Poverty Among Girls Under 16 |
| Costa Ricans | 64.2 /100 | #169 | Good 16.2% |
| Immigrants | Venezuela | 64.2 /100 | #170 | Good 16.2% |
| Immigrants | Saudi Arabia | 64.0 /100 | #171 | Good 16.2% |
| Afghans | 62.3 /100 | #172 | Good 16.2% |
| Immigrants | South America | 55.1 /100 | #173 | Average 16.4% |
| Ethiopians | 50.0 /100 | #174 | Average 16.5% |
| Lebanese | 45.4 /100 | #175 | Average 16.6% |
| Hungarians | 45.1 /100 | #176 | Average 16.6% |
| Immigrants | Western Asia | 44.1 /100 | #177 | Average 16.6% |
| Whites/Caucasians | 43.6 /100 | #178 | Average 16.6% |
| Hawaiians | 43.4 /100 | #179 | Average 16.6% |
| Immigrants | Syria | 43.3 /100 | #180 | Average 16.6% |
| Immigrants | Iraq | 43.2 /100 | #181 | Average 16.6% |
| Immigrants | Ethiopia | 43.1 /100 | #182 | Average 16.6% |
| Immigrants | Portugal | 42.5 /100 | #183 | Average 16.6% |
Demographics Similar to Shoshone by Child Poverty Among Girls Under 16
In terms of child poverty among girls under 16, the demographic groups most similar to Shoshone are Immigrants from Laos (18.9%, a difference of 0.030%), Ecuadorian (18.8%, a difference of 0.12%), Immigrants from Nicaragua (18.8%, a difference of 0.18%), Immigrants from Ghana (18.9%, a difference of 0.39%), and Immigrants from Cuba (18.8%, a difference of 0.40%).
| Demographics | Rating | Rank | Child Poverty Among Girls Under 16 |
| Immigrants | Eritrea | 1.0 /100 | #238 | Tragic 18.7% |
| Marshallese | 0.9 /100 | #239 | Tragic 18.7% |
| Nigerians | 0.9 /100 | #240 | Tragic 18.7% |
| Americans | 0.8 /100 | #241 | Tragic 18.8% |
| Immigrants | Cuba | 0.7 /100 | #242 | Tragic 18.8% |
| Immigrants | Nicaragua | 0.7 /100 | #243 | Tragic 18.8% |
| Ecuadorians | 0.7 /100 | #244 | Tragic 18.8% |
| Shoshone | 0.6 /100 | #245 | Tragic 18.9% |
| Immigrants | Laos | 0.6 /100 | #246 | Tragic 18.9% |
| Immigrants | Ghana | 0.5 /100 | #247 | Tragic 18.9% |
| French American Indians | 0.3 /100 | #248 | Tragic 19.2% |
| Potawatomi | 0.3 /100 | #249 | Tragic 19.2% |
| Cape Verdeans | 0.3 /100 | #250 | Tragic 19.2% |
| Immigrants | Trinidad and Tobago | 0.3 /100 | #251 | Tragic 19.2% |
| Immigrants | Middle Africa | 0.3 /100 | #252 | Tragic 19.2% |