Haitian vs Shoshone Child Poverty Among Girls Under 16
COMPARE
Haitian
Shoshone
Child Poverty Among Girls Under 16
Child Poverty Among Girls Under 16 Comparison
Haitians
Shoshone
20.5%
CHILD POVERTY AMONG GIRLS UNDER 16
0.0/ 100
METRIC RATING
288th/ 347
METRIC RANK
18.9%
CHILD POVERTY AMONG GIRLS UNDER 16
0.6/ 100
METRIC RATING
245th/ 347
METRIC RANK
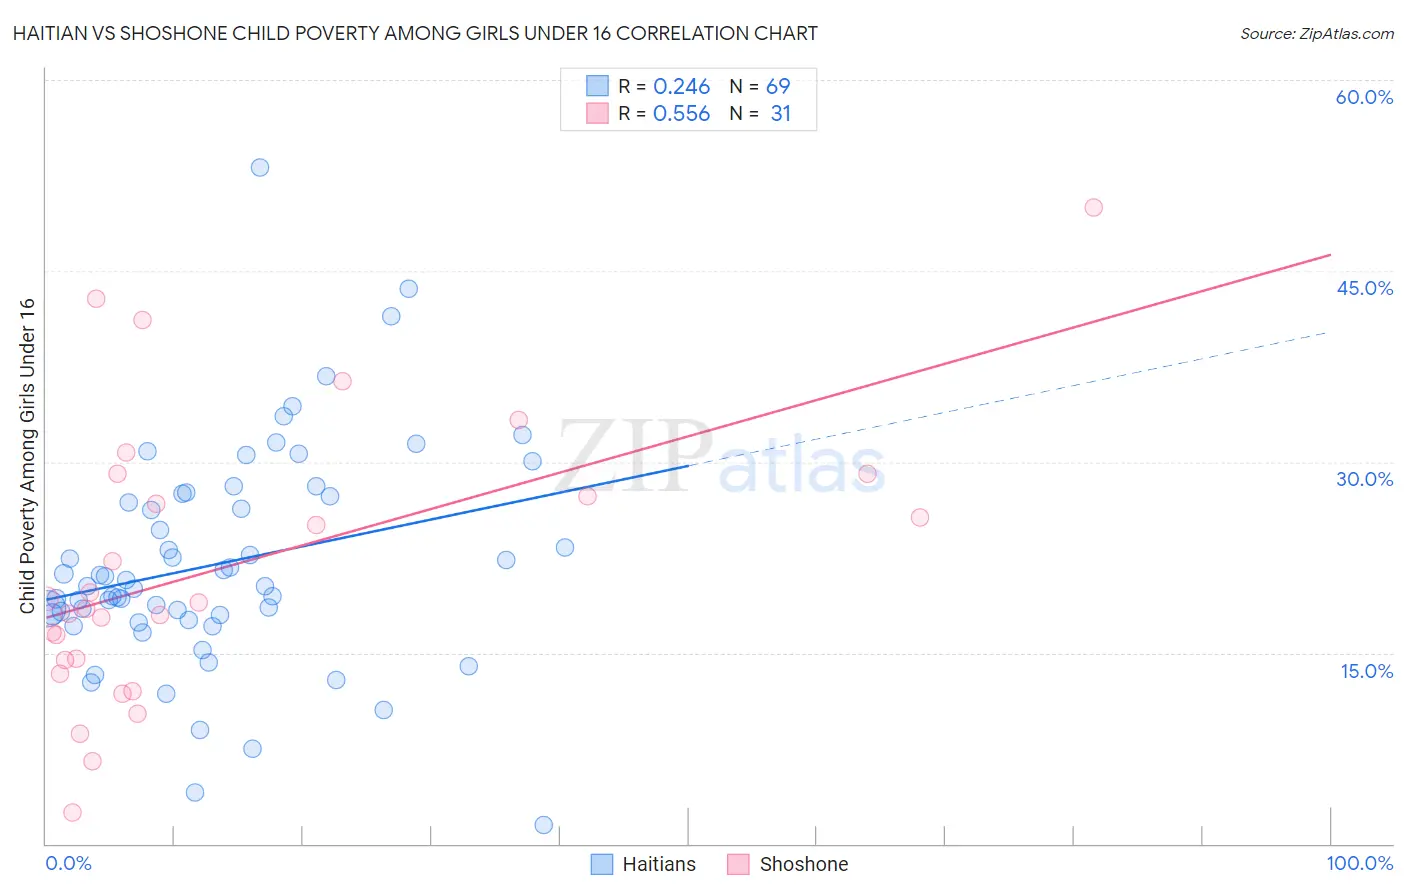
Haitian vs Shoshone Child Poverty Among Girls Under 16 Correlation Chart
The statistical analysis conducted on geographies consisting of 284,231,337 people shows a weak positive correlation between the proportion of Haitians and poverty level among girls under the age of 16 in the United States with a correlation coefficient (R) of 0.246 and weighted average of 20.5%. Similarly, the statistical analysis conducted on geographies consisting of 66,320,610 people shows a substantial positive correlation between the proportion of Shoshone and poverty level among girls under the age of 16 in the United States with a correlation coefficient (R) of 0.556 and weighted average of 18.9%, a difference of 8.7%.
Child Poverty Among Girls Under 16 Correlation Summary
| Measurement | Haitian | Shoshone |
| Minimum | 1.5% | 2.5% |
| Maximum | 53.2% | 50.0% |
| Range | 51.7% | 47.5% |
| Mean | 22.0% | 21.8% |
| Median | 20.2% | 18.9% |
| Interquartile 25% (IQ1) | 17.8% | 14.4% |
| Interquartile 75% (IQ3) | 27.4% | 29.0% |
| Interquartile Range (IQR) | 9.6% | 14.6% |
| Standard Deviation (Sample) | 8.7% | 11.0% |
| Standard Deviation (Population) | 8.7% | 10.8% |
Similar Demographics by Child Poverty Among Girls Under 16
Demographics Similar to Haitians by Child Poverty Among Girls Under 16
In terms of child poverty among girls under 16, the demographic groups most similar to Haitians are Blackfeet (20.5%, a difference of 0.20%), Iroquois (20.4%, a difference of 0.34%), Immigrants from Belize (20.6%, a difference of 0.46%), Immigrants from Haiti (20.6%, a difference of 0.53%), and Chippewa (20.6%, a difference of 0.67%).
| Demographics | Rating | Rank | Child Poverty Among Girls Under 16 |
| Central Americans | 0.0 /100 | #281 | Tragic 20.2% |
| West Indians | 0.0 /100 | #282 | Tragic 20.3% |
| Senegalese | 0.0 /100 | #283 | Tragic 20.3% |
| Yaqui | 0.0 /100 | #284 | Tragic 20.3% |
| Immigrants | Cabo Verde | 0.0 /100 | #285 | Tragic 20.3% |
| Iroquois | 0.0 /100 | #286 | Tragic 20.4% |
| Blackfeet | 0.0 /100 | #287 | Tragic 20.5% |
| Haitians | 0.0 /100 | #288 | Tragic 20.5% |
| Immigrants | Belize | 0.0 /100 | #289 | Tragic 20.6% |
| Immigrants | Haiti | 0.0 /100 | #290 | Tragic 20.6% |
| Chippewa | 0.0 /100 | #291 | Tragic 20.6% |
| Immigrants | Latin America | 0.0 /100 | #292 | Tragic 20.6% |
| Immigrants | Grenada | 0.0 /100 | #293 | Tragic 20.7% |
| Immigrants | Senegal | 0.0 /100 | #294 | Tragic 20.7% |
| Immigrants | Caribbean | 0.0 /100 | #295 | Tragic 20.7% |
Demographics Similar to Shoshone by Child Poverty Among Girls Under 16
In terms of child poverty among girls under 16, the demographic groups most similar to Shoshone are Immigrants from Laos (18.9%, a difference of 0.030%), Ecuadorian (18.8%, a difference of 0.12%), Immigrants from Nicaragua (18.8%, a difference of 0.18%), Immigrants from Ghana (18.9%, a difference of 0.39%), and Immigrants from Cuba (18.8%, a difference of 0.40%).
| Demographics | Rating | Rank | Child Poverty Among Girls Under 16 |
| Immigrants | Eritrea | 1.0 /100 | #238 | Tragic 18.7% |
| Marshallese | 0.9 /100 | #239 | Tragic 18.7% |
| Nigerians | 0.9 /100 | #240 | Tragic 18.7% |
| Americans | 0.8 /100 | #241 | Tragic 18.8% |
| Immigrants | Cuba | 0.7 /100 | #242 | Tragic 18.8% |
| Immigrants | Nicaragua | 0.7 /100 | #243 | Tragic 18.8% |
| Ecuadorians | 0.7 /100 | #244 | Tragic 18.8% |
| Shoshone | 0.6 /100 | #245 | Tragic 18.9% |
| Immigrants | Laos | 0.6 /100 | #246 | Tragic 18.9% |
| Immigrants | Ghana | 0.5 /100 | #247 | Tragic 18.9% |
| French American Indians | 0.3 /100 | #248 | Tragic 19.2% |
| Potawatomi | 0.3 /100 | #249 | Tragic 19.2% |
| Cape Verdeans | 0.3 /100 | #250 | Tragic 19.2% |
| Immigrants | Trinidad and Tobago | 0.3 /100 | #251 | Tragic 19.2% |
| Immigrants | Middle Africa | 0.3 /100 | #252 | Tragic 19.2% |