Hungarian vs Immigrants from Central America Child Poverty Among Girls Under 16
COMPARE
Hungarian
Immigrants from Central America
Child Poverty Among Girls Under 16
Child Poverty Among Girls Under 16 Comparison
Hungarians
Immigrants from Central America
16.6%
CHILD POVERTY AMONG GIRLS UNDER 16
45.1/ 100
METRIC RATING
176th/ 347
METRIC RANK
21.4%
CHILD POVERTY AMONG GIRLS UNDER 16
0.0/ 100
METRIC RATING
306th/ 347
METRIC RANK
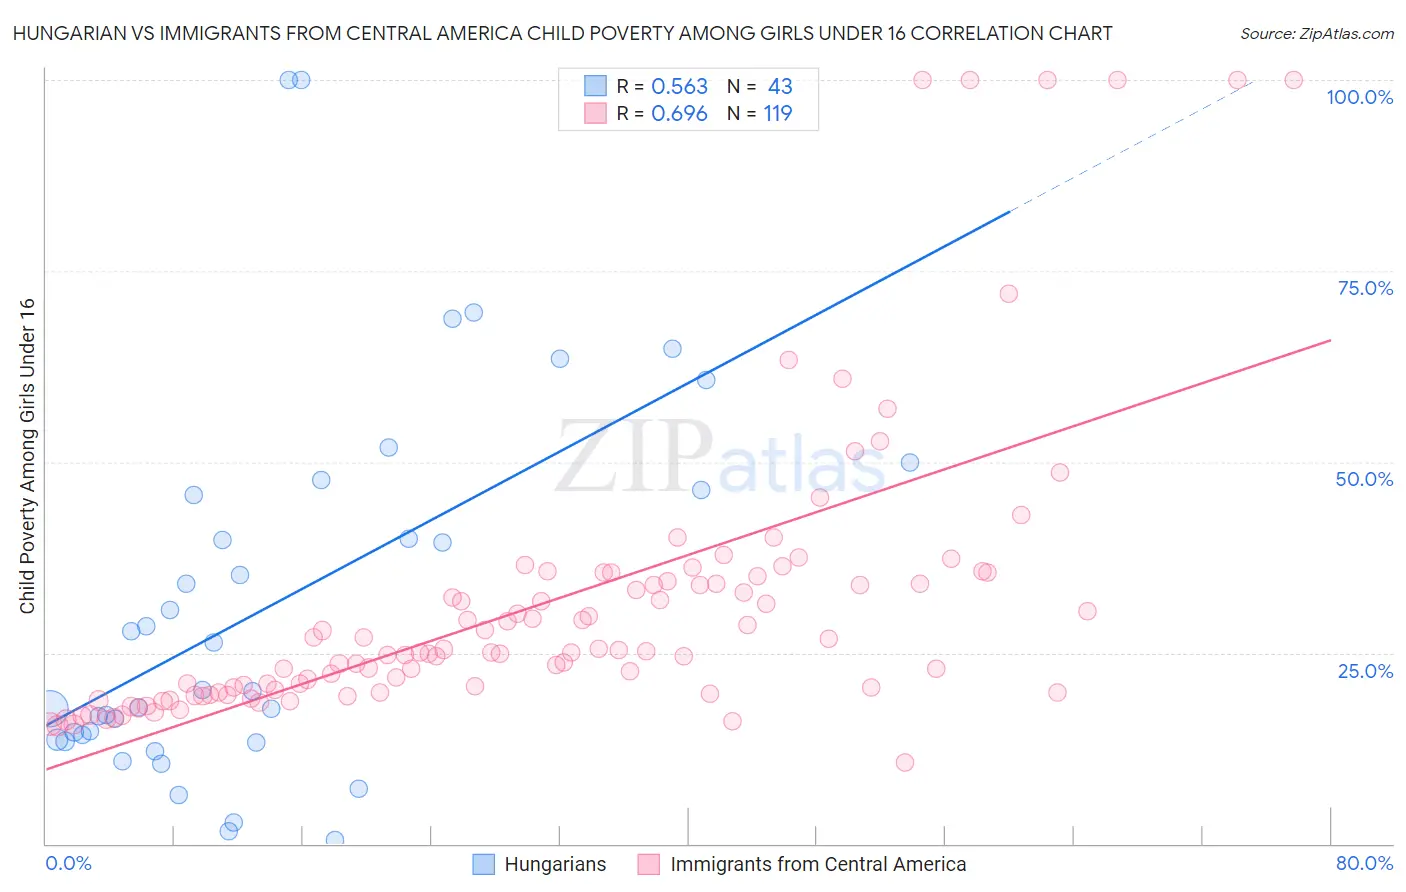
Hungarian vs Immigrants from Central America Child Poverty Among Girls Under 16 Correlation Chart
The statistical analysis conducted on geographies consisting of 471,414,008 people shows a substantial positive correlation between the proportion of Hungarians and poverty level among girls under the age of 16 in the United States with a correlation coefficient (R) of 0.563 and weighted average of 16.6%. Similarly, the statistical analysis conducted on geographies consisting of 521,407,533 people shows a significant positive correlation between the proportion of Immigrants from Central America and poverty level among girls under the age of 16 in the United States with a correlation coefficient (R) of 0.696 and weighted average of 21.4%, a difference of 29.5%.
Child Poverty Among Girls Under 16 Correlation Summary
| Measurement | Hungarian | Immigrants from Central America |
| Minimum | 0.46% | 10.7% |
| Maximum | 100.0% | 100.0% |
| Range | 99.5% | 89.3% |
| Mean | 31.4% | 31.3% |
| Median | 20.1% | 25.1% |
| Interquartile 25% (IQ1) | 13.6% | 19.7% |
| Interquartile 75% (IQ3) | 46.3% | 34.4% |
| Interquartile Range (IQR) | 32.7% | 14.7% |
| Standard Deviation (Sample) | 24.6% | 19.0% |
| Standard Deviation (Population) | 24.3% | 19.0% |
Similar Demographics by Child Poverty Among Girls Under 16
Demographics Similar to Hungarians by Child Poverty Among Girls Under 16
In terms of child poverty among girls under 16, the demographic groups most similar to Hungarians are Lebanese (16.6%, a difference of 0.030%), Immigrants from Western Asia (16.6%, a difference of 0.11%), White/Caucasian (16.6%, a difference of 0.17%), Hawaiian (16.6%, a difference of 0.20%), and Immigrants from Syria (16.6%, a difference of 0.21%).
| Demographics | Rating | Rank | Child Poverty Among Girls Under 16 |
| Costa Ricans | 64.2 /100 | #169 | Good 16.2% |
| Immigrants | Venezuela | 64.2 /100 | #170 | Good 16.2% |
| Immigrants | Saudi Arabia | 64.0 /100 | #171 | Good 16.2% |
| Afghans | 62.3 /100 | #172 | Good 16.2% |
| Immigrants | South America | 55.1 /100 | #173 | Average 16.4% |
| Ethiopians | 50.0 /100 | #174 | Average 16.5% |
| Lebanese | 45.4 /100 | #175 | Average 16.6% |
| Hungarians | 45.1 /100 | #176 | Average 16.6% |
| Immigrants | Western Asia | 44.1 /100 | #177 | Average 16.6% |
| Whites/Caucasians | 43.6 /100 | #178 | Average 16.6% |
| Hawaiians | 43.4 /100 | #179 | Average 16.6% |
| Immigrants | Syria | 43.3 /100 | #180 | Average 16.6% |
| Immigrants | Iraq | 43.2 /100 | #181 | Average 16.6% |
| Immigrants | Ethiopia | 43.1 /100 | #182 | Average 16.6% |
| Immigrants | Portugal | 42.5 /100 | #183 | Average 16.6% |
Demographics Similar to Immigrants from Central America by Child Poverty Among Girls Under 16
In terms of child poverty among girls under 16, the demographic groups most similar to Immigrants from Central America are Immigrants from Bahamas (21.4%, a difference of 0.010%), Guatemalan (21.4%, a difference of 0.17%), Houma (21.5%, a difference of 0.19%), Bahamian (21.5%, a difference of 0.31%), and Immigrants from Somalia (21.6%, a difference of 0.58%).
| Demographics | Rating | Rank | Child Poverty Among Girls Under 16 |
| Hispanics or Latinos | 0.0 /100 | #299 | Tragic 21.0% |
| Somalis | 0.0 /100 | #300 | Tragic 21.0% |
| Choctaw | 0.0 /100 | #301 | Tragic 21.1% |
| Seminole | 0.0 /100 | #302 | Tragic 21.2% |
| British West Indians | 0.0 /100 | #303 | Tragic 21.3% |
| Indonesians | 0.0 /100 | #304 | Tragic 21.3% |
| Guatemalans | 0.0 /100 | #305 | Tragic 21.4% |
| Immigrants | Central America | 0.0 /100 | #306 | Tragic 21.4% |
| Immigrants | Bahamas | 0.0 /100 | #307 | Tragic 21.4% |
| Houma | 0.0 /100 | #308 | Tragic 21.5% |
| Bahamians | 0.0 /100 | #309 | Tragic 21.5% |
| Immigrants | Somalia | 0.0 /100 | #310 | Tragic 21.6% |
| Dutch West Indians | 0.0 /100 | #311 | Tragic 21.6% |
| Immigrants | Mexico | 0.0 /100 | #312 | Tragic 21.6% |
| Creek | 0.0 /100 | #313 | Tragic 21.7% |