Hungarian vs Immigrants from Canada Child Poverty Among Boys Under 16
COMPARE
Hungarian
Immigrants from Canada
Child Poverty Among Boys Under 16
Child Poverty Among Boys Under 16 Comparison
Hungarians
Immigrants from Canada
16.5%
CHILD POVERTY AMONG BOYS UNDER 16
47.3/ 100
METRIC RATING
179th/ 347
METRIC RANK
14.7%
CHILD POVERTY AMONG BOYS UNDER 16
97.6/ 100
METRIC RATING
81st/ 347
METRIC RANK
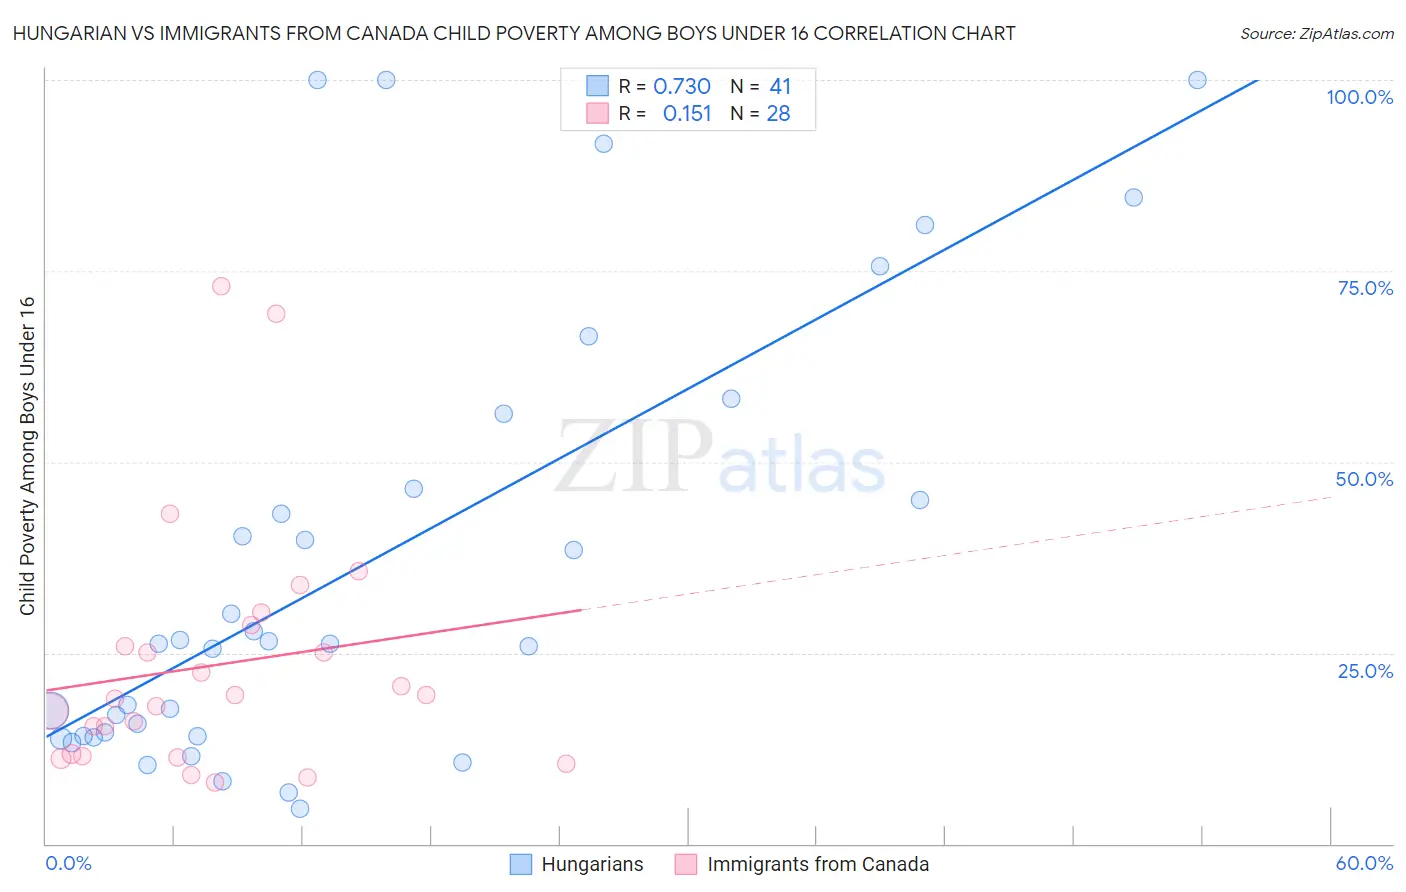
Hungarian vs Immigrants from Canada Child Poverty Among Boys Under 16 Correlation Chart
The statistical analysis conducted on geographies consisting of 472,859,251 people shows a strong positive correlation between the proportion of Hungarians and poverty level among boys under the age of 16 in the United States with a correlation coefficient (R) of 0.730 and weighted average of 16.5%. Similarly, the statistical analysis conducted on geographies consisting of 448,274,828 people shows a poor positive correlation between the proportion of Immigrants from Canada and poverty level among boys under the age of 16 in the United States with a correlation coefficient (R) of 0.151 and weighted average of 14.7%, a difference of 11.9%.
Child Poverty Among Boys Under 16 Correlation Summary
| Measurement | Hungarian | Immigrants from Canada |
| Minimum | 4.7% | 8.1% |
| Maximum | 100.0% | 72.9% |
| Range | 95.3% | 64.8% |
| Mean | 36.7% | 23.4% |
| Median | 26.3% | 19.3% |
| Interquartile 25% (IQ1) | 14.1% | 11.6% |
| Interquartile 75% (IQ3) | 51.4% | 27.2% |
| Interquartile Range (IQR) | 37.3% | 15.6% |
| Standard Deviation (Sample) | 28.9% | 16.1% |
| Standard Deviation (Population) | 28.5% | 15.8% |
Similar Demographics by Child Poverty Among Boys Under 16
Demographics Similar to Hungarians by Child Poverty Among Boys Under 16
In terms of child poverty among boys under 16, the demographic groups most similar to Hungarians are Scotch-Irish (16.5%, a difference of 0.020%), Ethiopian (16.5%, a difference of 0.060%), White/Caucasian (16.5%, a difference of 0.10%), Immigrants from Syria (16.5%, a difference of 0.19%), and Hawaiian (16.5%, a difference of 0.20%).
| Demographics | Rating | Rank | Child Poverty Among Boys Under 16 |
| Immigrants | Colombia | 50.8 /100 | #172 | Average 16.4% |
| Tsimshian | 50.5 /100 | #173 | Average 16.4% |
| Uruguayans | 50.0 /100 | #174 | Average 16.4% |
| Immigrants | Syria | 49.0 /100 | #175 | Average 16.5% |
| Whites/Caucasians | 48.2 /100 | #176 | Average 16.5% |
| Ethiopians | 47.8 /100 | #177 | Average 16.5% |
| Scotch-Irish | 47.5 /100 | #178 | Average 16.5% |
| Hungarians | 47.3 /100 | #179 | Average 16.5% |
| Hawaiians | 45.5 /100 | #180 | Average 16.5% |
| South American Indians | 44.3 /100 | #181 | Average 16.5% |
| Lebanese | 43.3 /100 | #182 | Average 16.6% |
| Kenyans | 41.0 /100 | #183 | Average 16.6% |
| Celtics | 40.6 /100 | #184 | Average 16.6% |
| Immigrants | Western Asia | 40.4 /100 | #185 | Average 16.6% |
| Hmong | 38.4 /100 | #186 | Fair 16.6% |
Demographics Similar to Immigrants from Canada by Child Poverty Among Boys Under 16
In terms of child poverty among boys under 16, the demographic groups most similar to Immigrants from Canada are Ukrainian (14.7%, a difference of 0.020%), Immigrants from Russia (14.7%, a difference of 0.14%), Immigrants from Eastern Europe (14.7%, a difference of 0.22%), Immigrants from South Africa (14.8%, a difference of 0.26%), and Egyptian (14.7%, a difference of 0.33%).
| Demographics | Rating | Rank | Child Poverty Among Boys Under 16 |
| Australians | 98.0 /100 | #74 | Exceptional 14.7% |
| Immigrants | Poland | 97.9 /100 | #75 | Exceptional 14.7% |
| Immigrants | Croatia | 97.9 /100 | #76 | Exceptional 14.7% |
| Macedonians | 97.9 /100 | #77 | Exceptional 14.7% |
| Egyptians | 97.8 /100 | #78 | Exceptional 14.7% |
| Immigrants | Eastern Europe | 97.8 /100 | #79 | Exceptional 14.7% |
| Immigrants | Russia | 97.7 /100 | #80 | Exceptional 14.7% |
| Immigrants | Canada | 97.6 /100 | #81 | Exceptional 14.7% |
| Ukrainians | 97.6 /100 | #82 | Exceptional 14.7% |
| Immigrants | South Africa | 97.4 /100 | #83 | Exceptional 14.8% |
| Swiss | 97.3 /100 | #84 | Exceptional 14.8% |
| Taiwanese | 97.3 /100 | #85 | Exceptional 14.8% |
| Germans | 97.2 /100 | #86 | Exceptional 14.8% |
| Northern Europeans | 97.2 /100 | #87 | Exceptional 14.8% |
| Immigrants | North America | 97.1 /100 | #88 | Exceptional 14.8% |