Hungarian vs Uruguayan Child Poverty Among Boys Under 16
COMPARE
Hungarian
Uruguayan
Child Poverty Among Boys Under 16
Child Poverty Among Boys Under 16 Comparison
Hungarians
Uruguayans
16.5%
CHILD POVERTY AMONG BOYS UNDER 16
47.3/ 100
METRIC RATING
179th/ 347
METRIC RANK
16.4%
CHILD POVERTY AMONG BOYS UNDER 16
50.0/ 100
METRIC RATING
174th/ 347
METRIC RANK
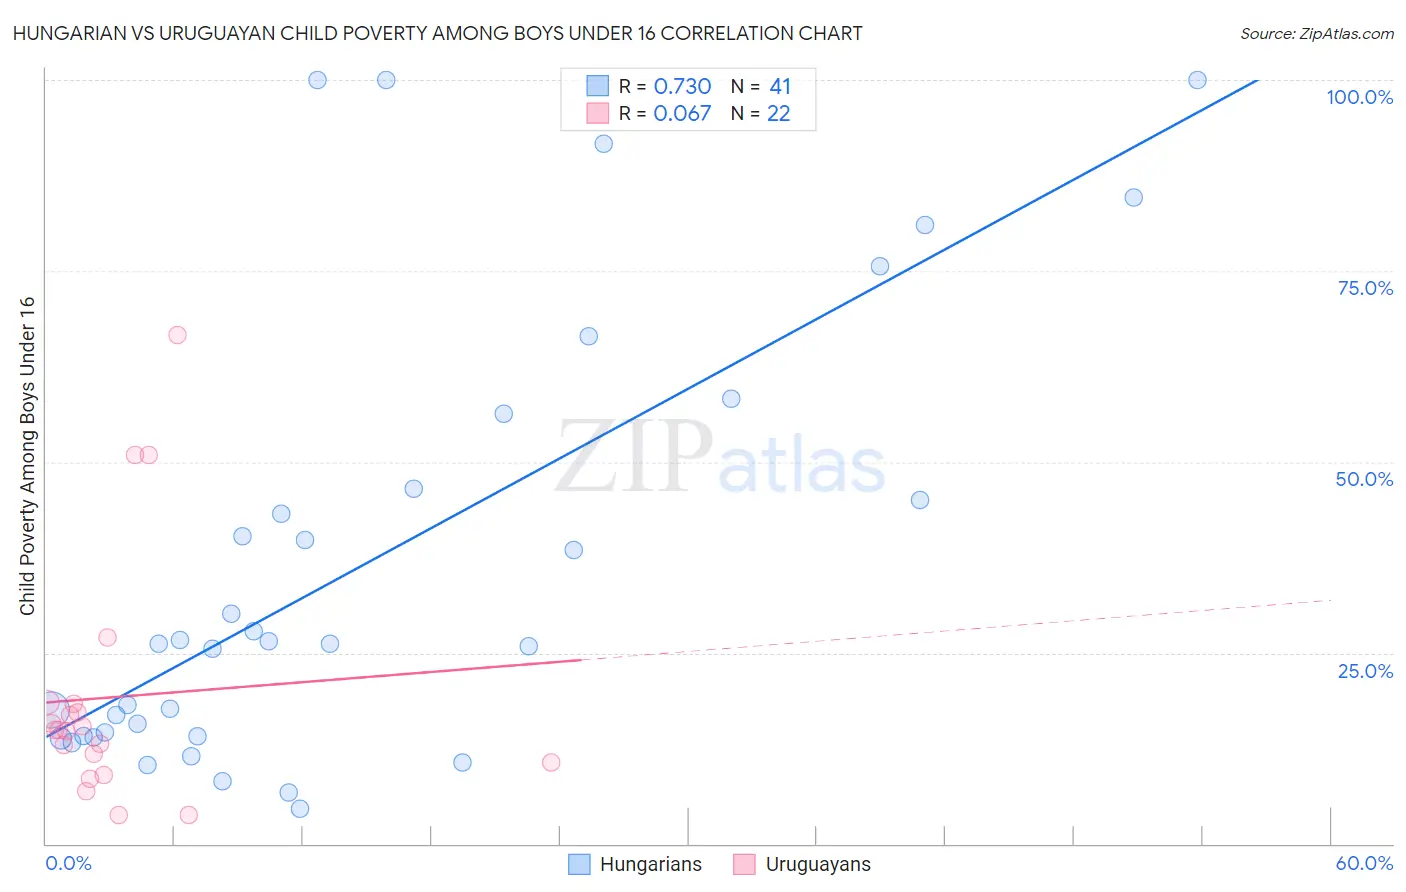
Hungarian vs Uruguayan Child Poverty Among Boys Under 16 Correlation Chart
The statistical analysis conducted on geographies consisting of 472,859,251 people shows a strong positive correlation between the proportion of Hungarians and poverty level among boys under the age of 16 in the United States with a correlation coefficient (R) of 0.730 and weighted average of 16.5%. Similarly, the statistical analysis conducted on geographies consisting of 143,820,486 people shows a slight positive correlation between the proportion of Uruguayans and poverty level among boys under the age of 16 in the United States with a correlation coefficient (R) of 0.067 and weighted average of 16.4%, a difference of 0.30%.
Child Poverty Among Boys Under 16 Correlation Summary
| Measurement | Hungarian | Uruguayan |
| Minimum | 4.7% | 3.7% |
| Maximum | 100.0% | 66.7% |
| Range | 95.3% | 63.0% |
| Mean | 36.7% | 19.2% |
| Median | 26.3% | 14.9% |
| Interquartile 25% (IQ1) | 14.1% | 10.7% |
| Interquartile 75% (IQ3) | 51.4% | 18.3% |
| Interquartile Range (IQR) | 37.3% | 7.6% |
| Standard Deviation (Sample) | 28.9% | 16.2% |
| Standard Deviation (Population) | 28.5% | 15.8% |
Demographics Similar to Hungarians and Uruguayans by Child Poverty Among Boys Under 16
In terms of child poverty among boys under 16, the demographic groups most similar to Hungarians are Scotch-Irish (16.5%, a difference of 0.020%), Ethiopian (16.5%, a difference of 0.060%), White/Caucasian (16.5%, a difference of 0.10%), Immigrants from Syria (16.5%, a difference of 0.19%), and Hawaiian (16.5%, a difference of 0.20%). Similarly, the demographic groups most similar to Uruguayans are Tsimshian (16.4%, a difference of 0.060%), Immigrants from Colombia (16.4%, a difference of 0.090%), Immigrants from Syria (16.5%, a difference of 0.11%), Immigrants from Ethiopia (16.4%, a difference of 0.14%), and Immigrants from Bosnia and Herzegovina (16.4%, a difference of 0.19%).
| Demographics | Rating | Rank | Child Poverty Among Boys Under 16 |
| Immigrants | Germany | 63.6 /100 | #166 | Good 16.2% |
| Afghans | 55.4 /100 | #167 | Average 16.3% |
| South Americans | 55.3 /100 | #168 | Average 16.3% |
| Immigrants | Saudi Arabia | 53.6 /100 | #169 | Average 16.4% |
| Immigrants | Bosnia and Herzegovina | 51.7 /100 | #170 | Average 16.4% |
| Immigrants | Ethiopia | 51.3 /100 | #171 | Average 16.4% |
| Immigrants | Colombia | 50.8 /100 | #172 | Average 16.4% |
| Tsimshian | 50.5 /100 | #173 | Average 16.4% |
| Uruguayans | 50.0 /100 | #174 | Average 16.4% |
| Immigrants | Syria | 49.0 /100 | #175 | Average 16.5% |
| Whites/Caucasians | 48.2 /100 | #176 | Average 16.5% |
| Ethiopians | 47.8 /100 | #177 | Average 16.5% |
| Scotch-Irish | 47.5 /100 | #178 | Average 16.5% |
| Hungarians | 47.3 /100 | #179 | Average 16.5% |
| Hawaiians | 45.5 /100 | #180 | Average 16.5% |
| South American Indians | 44.3 /100 | #181 | Average 16.5% |
| Lebanese | 43.3 /100 | #182 | Average 16.6% |
| Kenyans | 41.0 /100 | #183 | Average 16.6% |
| Celtics | 40.6 /100 | #184 | Average 16.6% |
| Immigrants | Western Asia | 40.4 /100 | #185 | Average 16.6% |
| Hmong | 38.4 /100 | #186 | Fair 16.6% |