Thai vs Cypriot Single Father Poverty
COMPARE
Thai
Cypriot
Single Father Poverty
Single Father Poverty Comparison
Thais
Cypriots
14.5%
SINGLE FATHER POVERTY
100.0/ 100
METRIC RATING
30th/ 347
METRIC RANK
15.9%
SINGLE FATHER POVERTY
87.5/ 100
METRIC RATING
136th/ 347
METRIC RANK
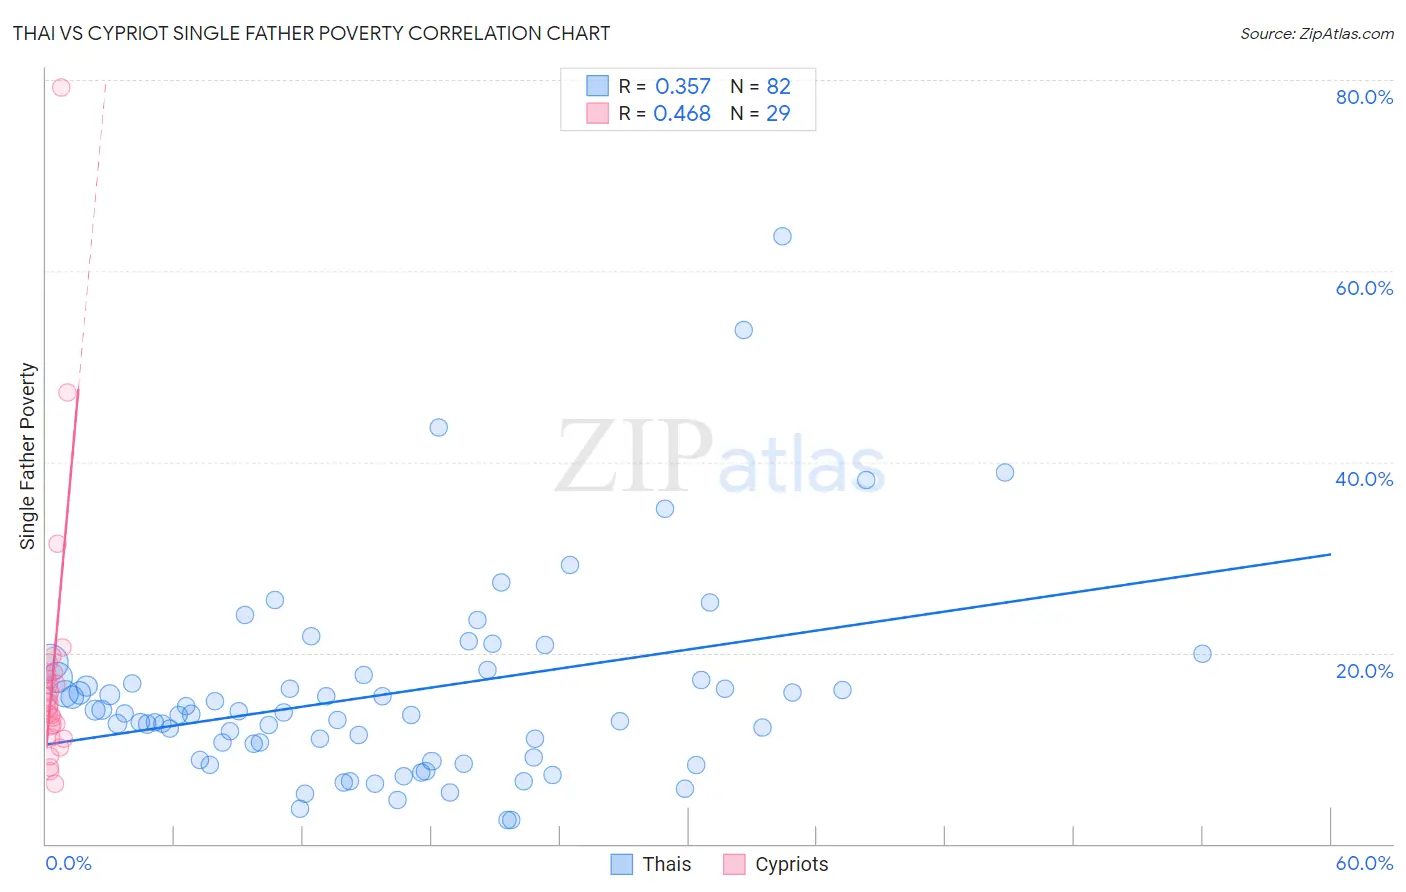
Thai vs Cypriot Single Father Poverty Correlation Chart
The statistical analysis conducted on geographies consisting of 363,511,447 people shows a mild positive correlation between the proportion of Thais and poverty level among single fathers in the United States with a correlation coefficient (R) of 0.357 and weighted average of 14.5%. Similarly, the statistical analysis conducted on geographies consisting of 55,535,084 people shows a moderate positive correlation between the proportion of Cypriots and poverty level among single fathers in the United States with a correlation coefficient (R) of 0.468 and weighted average of 15.9%, a difference of 9.8%.
Single Father Poverty Correlation Summary
| Measurement | Thai | Cypriot |
| Minimum | 2.5% | 6.2% |
| Maximum | 63.6% | 79.2% |
| Range | 61.2% | 72.9% |
| Mean | 15.7% | 17.9% |
| Median | 13.6% | 14.6% |
| Interquartile 25% (IQ1) | 9.0% | 11.7% |
| Interquartile 75% (IQ3) | 17.4% | 17.9% |
| Interquartile Range (IQR) | 8.4% | 6.2% |
| Standard Deviation (Sample) | 10.5% | 14.1% |
| Standard Deviation (Population) | 10.4% | 13.9% |
Similar Demographics by Single Father Poverty
Demographics Similar to Thais by Single Father Poverty
In terms of single father poverty, the demographic groups most similar to Thais are Somali (14.5%, a difference of 0.040%), Icelander (14.5%, a difference of 0.080%), Immigrants from South Central Asia (14.5%, a difference of 0.15%), Asian (14.6%, a difference of 0.24%), and Nepalese (14.4%, a difference of 0.68%).
| Demographics | Rating | Rank | Single Father Poverty |
| Immigrants | Egypt | 100.0 /100 | #23 | Exceptional 14.4% |
| Immigrants | South Eastern Asia | 100.0 /100 | #24 | Exceptional 14.4% |
| Iranians | 100.0 /100 | #25 | Exceptional 14.4% |
| Spanish American Indians | 100.0 /100 | #26 | Exceptional 14.4% |
| Nepalese | 100.0 /100 | #27 | Exceptional 14.4% |
| Immigrants | South Central Asia | 100.0 /100 | #28 | Exceptional 14.5% |
| Somalis | 100.0 /100 | #29 | Exceptional 14.5% |
| Thais | 100.0 /100 | #30 | Exceptional 14.5% |
| Icelanders | 100.0 /100 | #31 | Exceptional 14.5% |
| Asians | 100.0 /100 | #32 | Exceptional 14.6% |
| Okinawans | 100.0 /100 | #33 | Exceptional 14.6% |
| Egyptians | 100.0 /100 | #34 | Exceptional 14.7% |
| Immigrants | Bolivia | 100.0 /100 | #35 | Exceptional 14.7% |
| Immigrants | Indonesia | 100.0 /100 | #36 | Exceptional 14.7% |
| Immigrants | Eastern Africa | 100.0 /100 | #37 | Exceptional 14.7% |
Demographics Similar to Cypriots by Single Father Poverty
In terms of single father poverty, the demographic groups most similar to Cypriots are Immigrants from the Azores (15.9%, a difference of 0.030%), Central American (16.0%, a difference of 0.040%), Immigrants from Sri Lanka (15.9%, a difference of 0.070%), Immigrants from South America (15.9%, a difference of 0.10%), and South American (16.0%, a difference of 0.16%).
| Demographics | Rating | Rank | Single Father Poverty |
| Immigrants | West Indies | 90.8 /100 | #129 | Exceptional 15.9% |
| Norwegians | 90.2 /100 | #130 | Exceptional 15.9% |
| Nicaraguans | 90.1 /100 | #131 | Exceptional 15.9% |
| Immigrants | Portugal | 89.7 /100 | #132 | Excellent 15.9% |
| Immigrants | Syria | 89.5 /100 | #133 | Excellent 15.9% |
| Immigrants | South America | 88.5 /100 | #134 | Excellent 15.9% |
| Immigrants | Sri Lanka | 88.2 /100 | #135 | Excellent 15.9% |
| Cypriots | 87.5 /100 | #136 | Excellent 15.9% |
| Immigrants | Azores | 87.2 /100 | #137 | Excellent 15.9% |
| Central Americans | 87.1 /100 | #138 | Excellent 16.0% |
| South Americans | 85.9 /100 | #139 | Excellent 16.0% |
| Immigrants | Netherlands | 85.3 /100 | #140 | Excellent 16.0% |
| Liberians | 83.3 /100 | #141 | Excellent 16.0% |
| Immigrants | Mexico | 83.3 /100 | #142 | Excellent 16.0% |
| Immigrants | Central America | 83.1 /100 | #143 | Excellent 16.0% |