Hopi vs Barbadian Single Male Poverty
COMPARE
Hopi
Barbadian
Single Male Poverty
Single Male Poverty Comparison
Hopi
Barbadians
27.5%
SINGLE MALE POVERTY
0.0/ 100
METRIC RATING
346th/ 347
METRIC RANK
13.4%
SINGLE MALE POVERTY
2.1/ 100
METRIC RATING
243rd/ 347
METRIC RANK
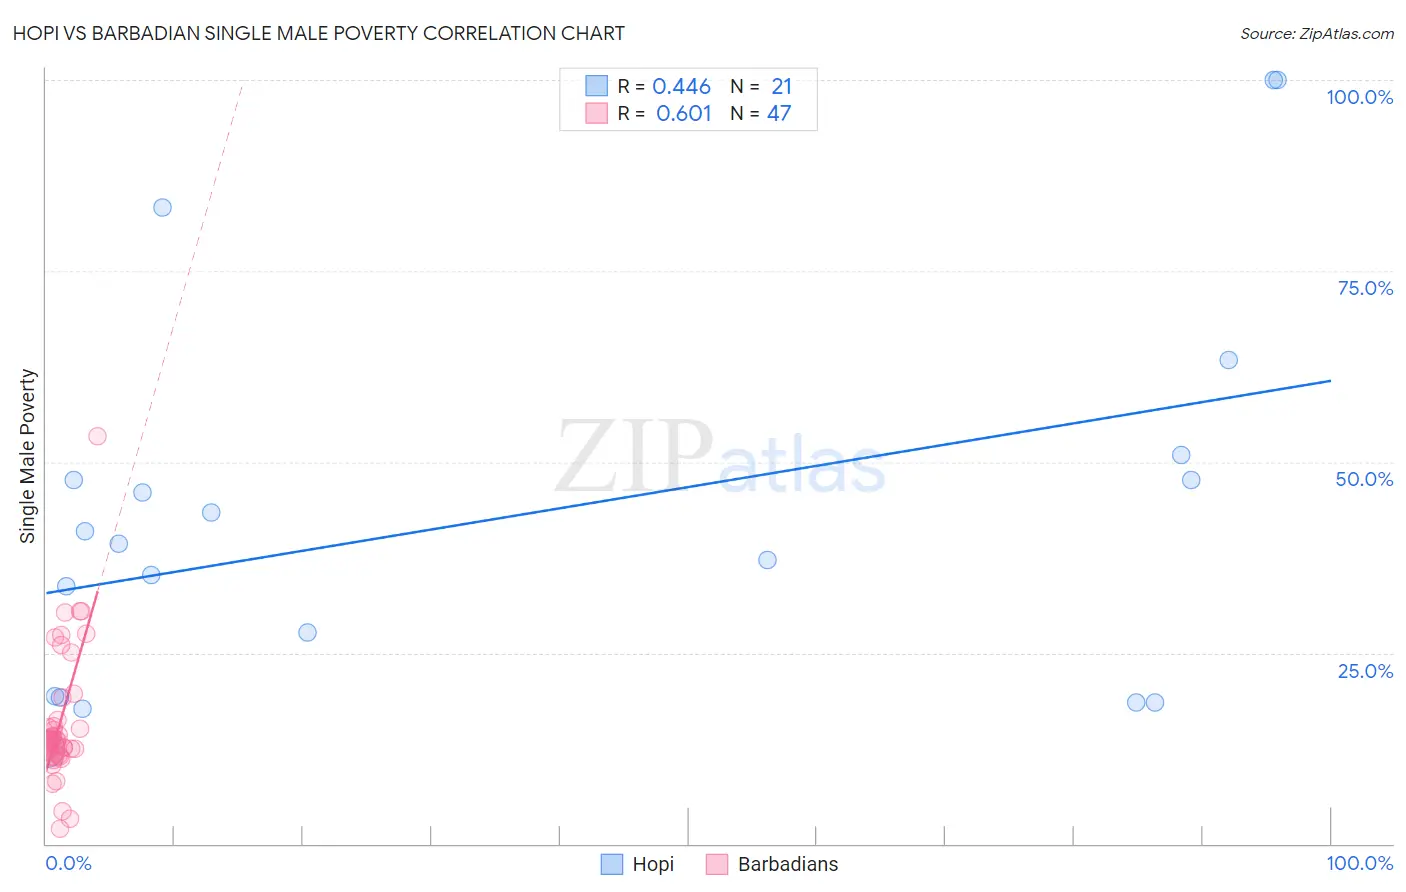
Hopi vs Barbadian Single Male Poverty Correlation Chart
The statistical analysis conducted on geographies consisting of 72,721,636 people shows a moderate positive correlation between the proportion of Hopi and poverty level among single males in the United States with a correlation coefficient (R) of 0.446 and weighted average of 27.5%. Similarly, the statistical analysis conducted on geographies consisting of 135,240,511 people shows a significant positive correlation between the proportion of Barbadians and poverty level among single males in the United States with a correlation coefficient (R) of 0.601 and weighted average of 13.4%, a difference of 104.5%.
Single Male Poverty Correlation Summary
| Measurement | Hopi | Barbadian |
| Minimum | 12.4% | 2.0% |
| Maximum | 100.0% | 53.3% |
| Range | 87.6% | 51.3% |
| Mean | 42.9% | 15.9% |
| Median | 39.3% | 13.4% |
| Interquartile 25% (IQ1) | 19.3% | 12.0% |
| Interquartile 75% (IQ3) | 49.3% | 16.2% |
| Interquartile Range (IQR) | 30.0% | 4.2% |
| Standard Deviation (Sample) | 25.5% | 8.8% |
| Standard Deviation (Population) | 24.9% | 8.7% |
Similar Demographics by Single Male Poverty
Demographics Similar to Hopi by Single Male Poverty
In terms of single male poverty, the demographic groups most similar to Hopi are Navajo (25.3%, a difference of 8.5%), Lumbee (25.2%, a difference of 9.3%), Puerto Rican (25.1%, a difference of 9.7%), Yup'ik (31.6%, a difference of 15.0%), and Houma (23.5%, a difference of 17.3%).
| Demographics | Rating | Rank | Single Male Poverty |
| Inupiat | 0.0 /100 | #333 | Tragic 20.0% |
| Pima | 0.0 /100 | #334 | Tragic 20.2% |
| Yuman | 0.0 /100 | #335 | Tragic 21.3% |
| Tohono O'odham | 0.0 /100 | #336 | Tragic 21.6% |
| Apache | 0.0 /100 | #337 | Tragic 21.6% |
| Pueblo | 0.0 /100 | #338 | Tragic 21.6% |
| Arapaho | 0.0 /100 | #339 | Tragic 21.9% |
| Sioux | 0.0 /100 | #340 | Tragic 22.2% |
| Crow | 0.0 /100 | #341 | Tragic 23.3% |
| Houma | 0.0 /100 | #342 | Tragic 23.5% |
| Puerto Ricans | 0.0 /100 | #343 | Tragic 25.1% |
| Lumbee | 0.0 /100 | #344 | Tragic 25.2% |
| Navajo | 0.0 /100 | #345 | Tragic 25.3% |
| Hopi | 0.0 /100 | #346 | Tragic 27.5% |
| Yup'ik | 0.0 /100 | #347 | Tragic 31.6% |
Demographics Similar to Barbadians by Single Male Poverty
In terms of single male poverty, the demographic groups most similar to Barbadians are Carpatho Rusyn (13.4%, a difference of 0.050%), Immigrants from Germany (13.4%, a difference of 0.060%), Belizean (13.4%, a difference of 0.17%), Immigrants from Senegal (13.5%, a difference of 0.28%), and Czechoslovakian (13.4%, a difference of 0.47%).
| Demographics | Rating | Rank | Single Male Poverty |
| Luxembourgers | 3.6 /100 | #236 | Tragic 13.4% |
| British West Indians | 3.4 /100 | #237 | Tragic 13.4% |
| Immigrants | Ghana | 3.2 /100 | #238 | Tragic 13.4% |
| Czechoslovakians | 3.0 /100 | #239 | Tragic 13.4% |
| Belizeans | 2.3 /100 | #240 | Tragic 13.4% |
| Immigrants | Germany | 2.1 /100 | #241 | Tragic 13.4% |
| Carpatho Rusyns | 2.1 /100 | #242 | Tragic 13.4% |
| Barbadians | 2.1 /100 | #243 | Tragic 13.4% |
| Immigrants | Senegal | 1.7 /100 | #244 | Tragic 13.5% |
| Immigrants | Latin America | 1.3 /100 | #245 | Tragic 13.5% |
| Immigrants | Micronesia | 1.2 /100 | #246 | Tragic 13.5% |
| Belgians | 1.2 /100 | #247 | Tragic 13.5% |
| Czechs | 1.2 /100 | #248 | Tragic 13.5% |
| Spanish | 1.0 /100 | #249 | Tragic 13.6% |
| Immigrants | Somalia | 1.0 /100 | #250 | Tragic 13.6% |