Syrian vs Barbadian Single Male Poverty
COMPARE
Syrian
Barbadian
Single Male Poverty
Single Male Poverty Comparison
Syrians
Barbadians
12.8%
SINGLE MALE POVERTY
48.4/ 100
METRIC RATING
176th/ 347
METRIC RANK
13.4%
SINGLE MALE POVERTY
2.1/ 100
METRIC RATING
243rd/ 347
METRIC RANK
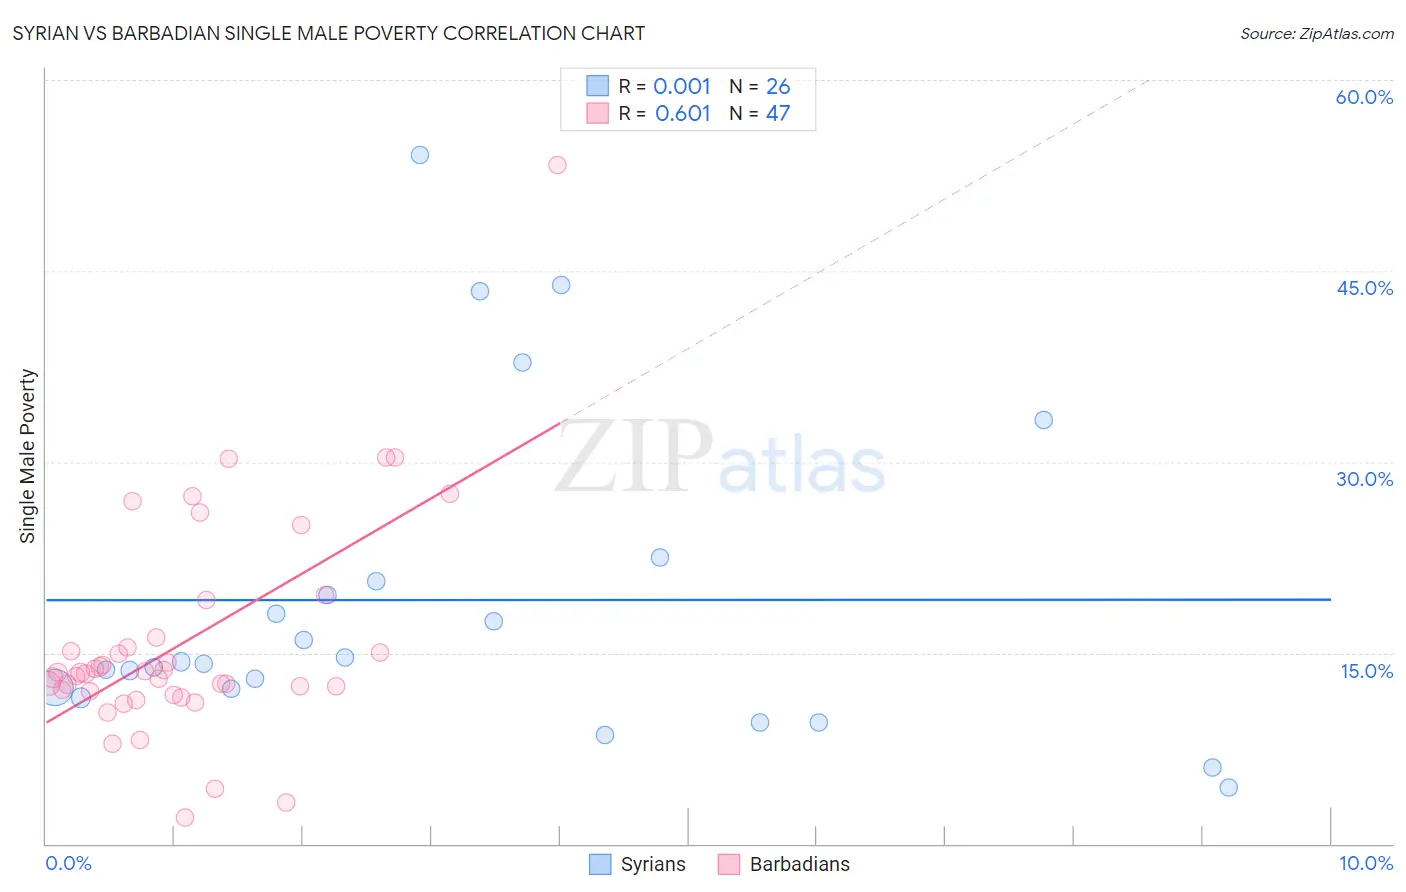
Syrian vs Barbadian Single Male Poverty Correlation Chart
The statistical analysis conducted on geographies consisting of 240,186,917 people shows no correlation between the proportion of Syrians and poverty level among single males in the United States with a correlation coefficient (R) of 0.001 and weighted average of 12.8%. Similarly, the statistical analysis conducted on geographies consisting of 135,240,511 people shows a significant positive correlation between the proportion of Barbadians and poverty level among single males in the United States with a correlation coefficient (R) of 0.601 and weighted average of 13.4%, a difference of 5.0%.
Single Male Poverty Correlation Summary
| Measurement | Syrian | Barbadian |
| Minimum | 4.4% | 2.0% |
| Maximum | 54.1% | 53.3% |
| Range | 49.7% | 51.3% |
| Mean | 19.1% | 15.9% |
| Median | 14.2% | 13.4% |
| Interquartile 25% (IQ1) | 12.2% | 12.0% |
| Interquartile 75% (IQ3) | 20.6% | 16.2% |
| Interquartile Range (IQR) | 8.5% | 4.2% |
| Standard Deviation (Sample) | 12.7% | 8.8% |
| Standard Deviation (Population) | 12.5% | 8.7% |
Similar Demographics by Single Male Poverty
Demographics Similar to Syrians by Single Male Poverty
In terms of single male poverty, the demographic groups most similar to Syrians are Croatian (12.8%, a difference of 0.020%), Costa Rican (12.8%, a difference of 0.080%), Immigrants from St. Vincent and the Grenadines (12.8%, a difference of 0.13%), South African (12.8%, a difference of 0.16%), and Danish (12.8%, a difference of 0.16%).
| Demographics | Rating | Rank | Single Male Poverty |
| Puget Sound Salish | 54.3 /100 | #169 | Average 12.8% |
| Guyanese | 52.0 /100 | #170 | Average 12.8% |
| South Africans | 51.5 /100 | #171 | Average 12.8% |
| Danes | 51.4 /100 | #172 | Average 12.8% |
| Immigrants | St. Vincent and the Grenadines | 50.9 /100 | #173 | Average 12.8% |
| Costa Ricans | 50.0 /100 | #174 | Average 12.8% |
| Croatians | 48.9 /100 | #175 | Average 12.8% |
| Syrians | 48.4 /100 | #176 | Average 12.8% |
| Immigrants | Canada | 44.8 /100 | #177 | Average 12.8% |
| Immigrants | Switzerland | 43.1 /100 | #178 | Average 12.8% |
| Israelis | 41.0 /100 | #179 | Average 12.9% |
| Immigrants | North America | 37.7 /100 | #180 | Fair 12.9% |
| Panamanians | 37.6 /100 | #181 | Fair 12.9% |
| Moroccans | 36.8 /100 | #182 | Fair 12.9% |
| Immigrants | West Indies | 33.0 /100 | #183 | Fair 12.9% |
Demographics Similar to Barbadians by Single Male Poverty
In terms of single male poverty, the demographic groups most similar to Barbadians are Carpatho Rusyn (13.4%, a difference of 0.050%), Immigrants from Germany (13.4%, a difference of 0.060%), Belizean (13.4%, a difference of 0.17%), Immigrants from Senegal (13.5%, a difference of 0.28%), and Czechoslovakian (13.4%, a difference of 0.47%).
| Demographics | Rating | Rank | Single Male Poverty |
| Luxembourgers | 3.6 /100 | #236 | Tragic 13.4% |
| British West Indians | 3.4 /100 | #237 | Tragic 13.4% |
| Immigrants | Ghana | 3.2 /100 | #238 | Tragic 13.4% |
| Czechoslovakians | 3.0 /100 | #239 | Tragic 13.4% |
| Belizeans | 2.3 /100 | #240 | Tragic 13.4% |
| Immigrants | Germany | 2.1 /100 | #241 | Tragic 13.4% |
| Carpatho Rusyns | 2.1 /100 | #242 | Tragic 13.4% |
| Barbadians | 2.1 /100 | #243 | Tragic 13.4% |
| Immigrants | Senegal | 1.7 /100 | #244 | Tragic 13.5% |
| Immigrants | Latin America | 1.3 /100 | #245 | Tragic 13.5% |
| Immigrants | Micronesia | 1.2 /100 | #246 | Tragic 13.5% |
| Belgians | 1.2 /100 | #247 | Tragic 13.5% |
| Czechs | 1.2 /100 | #248 | Tragic 13.5% |
| Spanish | 1.0 /100 | #249 | Tragic 13.6% |
| Immigrants | Somalia | 1.0 /100 | #250 | Tragic 13.6% |