Immigrants from South Central Asia vs Barbadian Single Male Poverty
COMPARE
Immigrants from South Central Asia
Barbadian
Single Male Poverty
Single Male Poverty Comparison
Immigrants from South Central Asia
Barbadians
10.9%
SINGLE MALE POVERTY
100.0/ 100
METRIC RATING
13th/ 347
METRIC RANK
13.4%
SINGLE MALE POVERTY
2.1/ 100
METRIC RATING
243rd/ 347
METRIC RANK
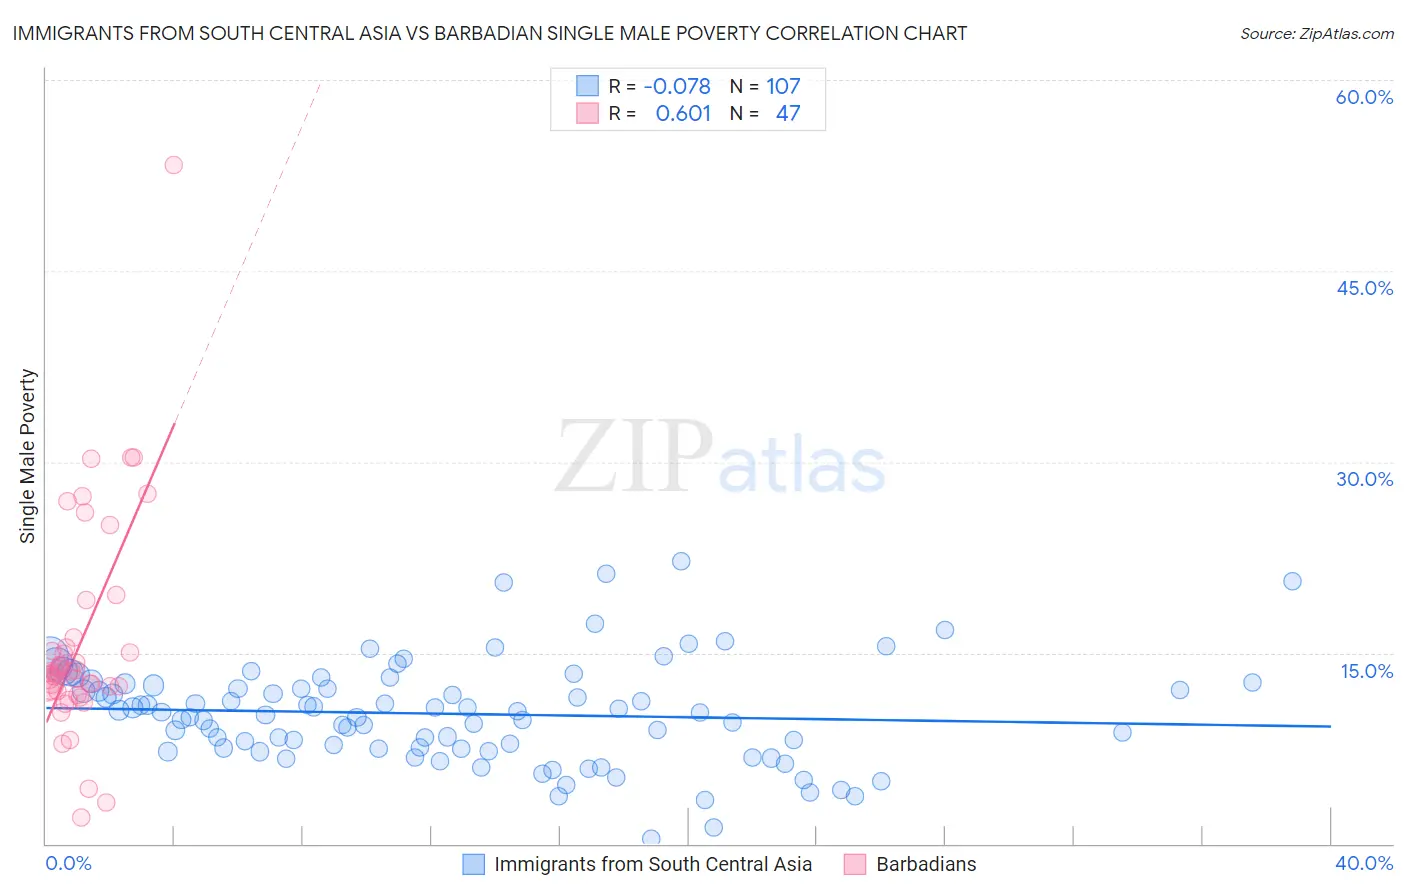
Immigrants from South Central Asia vs Barbadian Single Male Poverty Correlation Chart
The statistical analysis conducted on geographies consisting of 409,069,639 people shows a slight negative correlation between the proportion of Immigrants from South Central Asia and poverty level among single males in the United States with a correlation coefficient (R) of -0.078 and weighted average of 10.9%. Similarly, the statistical analysis conducted on geographies consisting of 135,240,511 people shows a significant positive correlation between the proportion of Barbadians and poverty level among single males in the United States with a correlation coefficient (R) of 0.601 and weighted average of 13.4%, a difference of 23.2%.
Single Male Poverty Correlation Summary
| Measurement | Immigrants from South Central Asia | Barbadian |
| Minimum | 0.44% | 2.0% |
| Maximum | 22.2% | 53.3% |
| Range | 21.8% | 51.3% |
| Mean | 10.2% | 15.9% |
| Median | 10.3% | 13.4% |
| Interquartile 25% (IQ1) | 7.5% | 12.0% |
| Interquartile 75% (IQ3) | 12.4% | 16.2% |
| Interquartile Range (IQR) | 4.9% | 4.2% |
| Standard Deviation (Sample) | 4.0% | 8.8% |
| Standard Deviation (Population) | 4.0% | 8.7% |
Similar Demographics by Single Male Poverty
Demographics Similar to Immigrants from South Central Asia by Single Male Poverty
In terms of single male poverty, the demographic groups most similar to Immigrants from South Central Asia are Immigrants from Afghanistan (10.9%, a difference of 0.12%), Immigrants from Philippines (10.9%, a difference of 0.20%), Immigrants from Fiji (10.9%, a difference of 0.22%), Taiwanese (10.9%, a difference of 0.27%), and Chinese (11.0%, a difference of 0.57%).
| Demographics | Rating | Rank | Single Male Poverty |
| Filipinos | 100.0 /100 | #6 | Exceptional 10.6% |
| Afghans | 100.0 /100 | #7 | Exceptional 10.7% |
| Thais | 100.0 /100 | #8 | Exceptional 10.8% |
| Taiwanese | 100.0 /100 | #9 | Exceptional 10.9% |
| Immigrants | Fiji | 100.0 /100 | #10 | Exceptional 10.9% |
| Immigrants | Philippines | 100.0 /100 | #11 | Exceptional 10.9% |
| Immigrants | Afghanistan | 100.0 /100 | #12 | Exceptional 10.9% |
| Immigrants | South Central Asia | 100.0 /100 | #13 | Exceptional 10.9% |
| Chinese | 100.0 /100 | #14 | Exceptional 11.0% |
| Koreans | 100.0 /100 | #15 | Exceptional 11.0% |
| Bhutanese | 100.0 /100 | #16 | Exceptional 11.1% |
| Tsimshian | 100.0 /100 | #17 | Exceptional 11.1% |
| Immigrants | Bolivia | 100.0 /100 | #18 | Exceptional 11.1% |
| Immigrants | Moldova | 100.0 /100 | #19 | Exceptional 11.2% |
| Ethiopians | 100.0 /100 | #20 | Exceptional 11.2% |
Demographics Similar to Barbadians by Single Male Poverty
In terms of single male poverty, the demographic groups most similar to Barbadians are Carpatho Rusyn (13.4%, a difference of 0.050%), Immigrants from Germany (13.4%, a difference of 0.060%), Belizean (13.4%, a difference of 0.17%), Immigrants from Senegal (13.5%, a difference of 0.28%), and Czechoslovakian (13.4%, a difference of 0.47%).
| Demographics | Rating | Rank | Single Male Poverty |
| Luxembourgers | 3.6 /100 | #236 | Tragic 13.4% |
| British West Indians | 3.4 /100 | #237 | Tragic 13.4% |
| Immigrants | Ghana | 3.2 /100 | #238 | Tragic 13.4% |
| Czechoslovakians | 3.0 /100 | #239 | Tragic 13.4% |
| Belizeans | 2.3 /100 | #240 | Tragic 13.4% |
| Immigrants | Germany | 2.1 /100 | #241 | Tragic 13.4% |
| Carpatho Rusyns | 2.1 /100 | #242 | Tragic 13.4% |
| Barbadians | 2.1 /100 | #243 | Tragic 13.4% |
| Immigrants | Senegal | 1.7 /100 | #244 | Tragic 13.5% |
| Immigrants | Latin America | 1.3 /100 | #245 | Tragic 13.5% |
| Immigrants | Micronesia | 1.2 /100 | #246 | Tragic 13.5% |
| Belgians | 1.2 /100 | #247 | Tragic 13.5% |
| Czechs | 1.2 /100 | #248 | Tragic 13.5% |
| Spanish | 1.0 /100 | #249 | Tragic 13.6% |
| Immigrants | Somalia | 1.0 /100 | #250 | Tragic 13.6% |