Argentinean vs Alaskan Athabascan Single Mother Poverty
COMPARE
Argentinean
Alaskan Athabascan
Single Mother Poverty
Single Mother Poverty Comparison
Argentineans
Alaskan Athabascans
27.2%
SINGLE MOTHER POVERTY
99.6/ 100
METRIC RATING
58th/ 347
METRIC RANK
30.3%
SINGLE MOTHER POVERTY
4.1/ 100
METRIC RATING
232nd/ 347
METRIC RANK
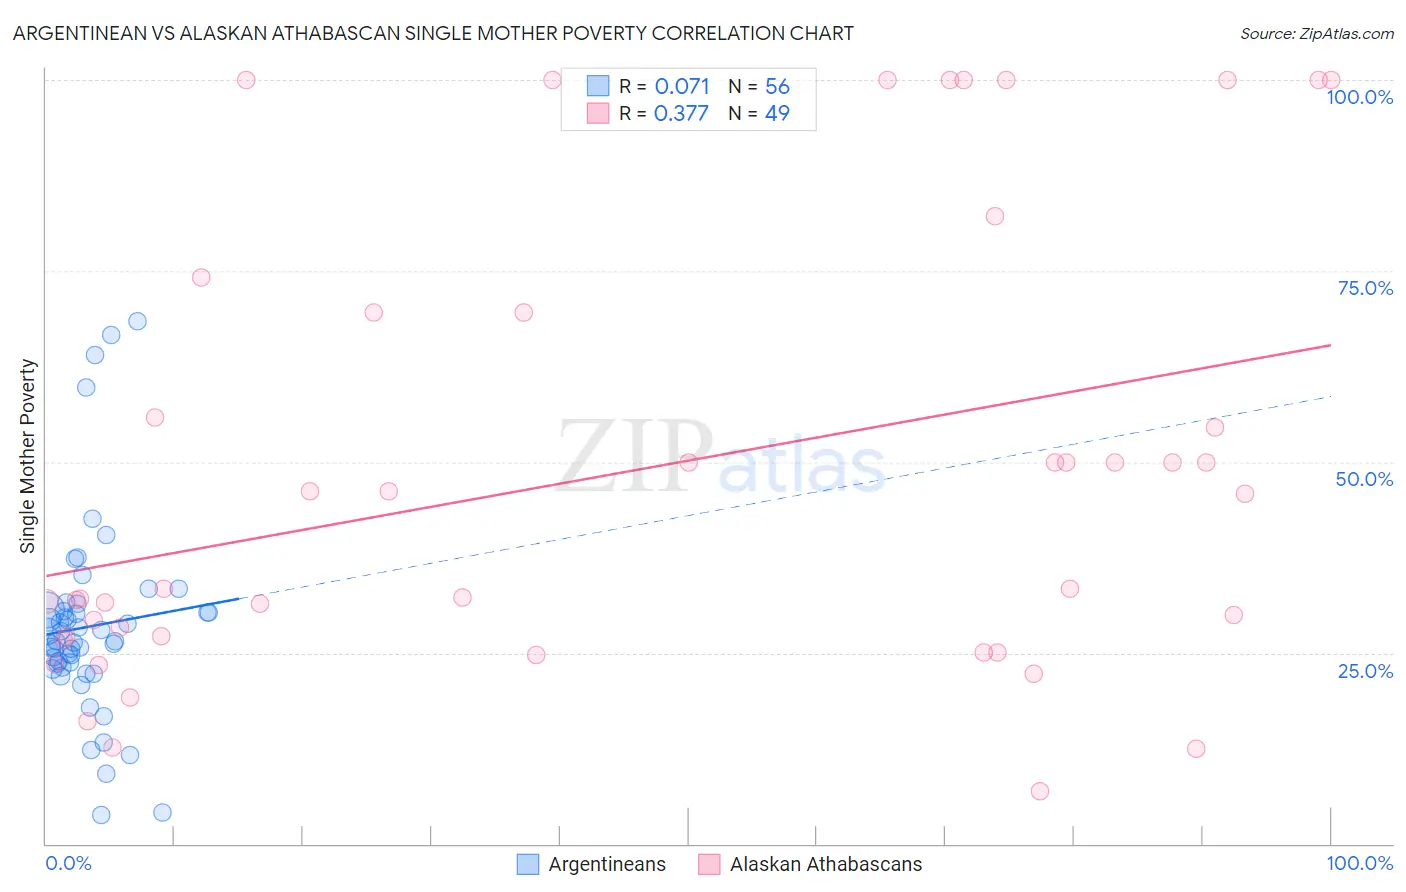
Argentinean vs Alaskan Athabascan Single Mother Poverty Correlation Chart
The statistical analysis conducted on geographies consisting of 291,528,298 people shows a slight positive correlation between the proportion of Argentineans and poverty level among single mothers in the United States with a correlation coefficient (R) of 0.071 and weighted average of 27.2%. Similarly, the statistical analysis conducted on geographies consisting of 45,529,547 people shows a mild positive correlation between the proportion of Alaskan Athabascans and poverty level among single mothers in the United States with a correlation coefficient (R) of 0.377 and weighted average of 30.3%, a difference of 11.2%.
Single Mother Poverty Correlation Summary
| Measurement | Argentinean | Alaskan Athabascan |
| Minimum | 3.7% | 6.8% |
| Maximum | 68.3% | 100.0% |
| Range | 64.6% | 93.2% |
| Mean | 28.4% | 48.6% |
| Median | 26.5% | 33.3% |
| Interquartile 25% (IQ1) | 23.3% | 26.9% |
| Interquartile 75% (IQ3) | 30.6% | 69.6% |
| Interquartile Range (IQR) | 7.3% | 42.6% |
| Standard Deviation (Sample) | 12.7% | 29.3% |
| Standard Deviation (Population) | 12.6% | 29.0% |
Similar Demographics by Single Mother Poverty
Demographics Similar to Argentineans by Single Mother Poverty
In terms of single mother poverty, the demographic groups most similar to Argentineans are Paraguayan (27.2%, a difference of 0.010%), Eastern European (27.2%, a difference of 0.050%), Palestinian (27.2%, a difference of 0.15%), Immigrants from Eastern Europe (27.2%, a difference of 0.16%), and Immigrants from Romania (27.2%, a difference of 0.18%).
| Demographics | Rating | Rank | Single Mother Poverty |
| Immigrants | Argentina | 99.7 /100 | #51 | Exceptional 27.1% |
| Immigrants | South Eastern Asia | 99.7 /100 | #52 | Exceptional 27.1% |
| Immigrants | Jordan | 99.7 /100 | #53 | Exceptional 27.1% |
| Immigrants | Bulgaria | 99.7 /100 | #54 | Exceptional 27.1% |
| Immigrants | Egypt | 99.7 /100 | #55 | Exceptional 27.1% |
| Immigrants | Romania | 99.7 /100 | #56 | Exceptional 27.2% |
| Palestinians | 99.7 /100 | #57 | Exceptional 27.2% |
| Argentineans | 99.6 /100 | #58 | Exceptional 27.2% |
| Paraguayans | 99.6 /100 | #59 | Exceptional 27.2% |
| Eastern Europeans | 99.6 /100 | #60 | Exceptional 27.2% |
| Immigrants | Eastern Europe | 99.6 /100 | #61 | Exceptional 27.2% |
| Immigrants | Malaysia | 99.5 /100 | #62 | Exceptional 27.3% |
| Immigrants | Northern Europe | 99.5 /100 | #63 | Exceptional 27.3% |
| Russians | 99.5 /100 | #64 | Exceptional 27.3% |
| Immigrants | Turkey | 99.5 /100 | #65 | Exceptional 27.3% |
Demographics Similar to Alaskan Athabascans by Single Mother Poverty
In terms of single mother poverty, the demographic groups most similar to Alaskan Athabascans are Dutch (30.2%, a difference of 0.040%), English (30.2%, a difference of 0.19%), Immigrants from Middle Africa (30.3%, a difference of 0.21%), Immigrants from Nicaragua (30.3%, a difference of 0.22%), and Immigrants from Barbados (30.2%, a difference of 0.23%).
| Demographics | Rating | Rank | Single Mother Poverty |
| Spanish | 6.3 /100 | #225 | Tragic 30.1% |
| Scottish | 6.0 /100 | #226 | Tragic 30.1% |
| Immigrants | Liberia | 5.9 /100 | #227 | Tragic 30.1% |
| Spaniards | 5.4 /100 | #228 | Tragic 30.2% |
| Immigrants | Barbados | 5.0 /100 | #229 | Tragic 30.2% |
| English | 4.8 /100 | #230 | Tragic 30.2% |
| Dutch | 4.3 /100 | #231 | Tragic 30.2% |
| Alaskan Athabascans | 4.1 /100 | #232 | Tragic 30.3% |
| Immigrants | Middle Africa | 3.5 /100 | #233 | Tragic 30.3% |
| Immigrants | Nicaragua | 3.5 /100 | #234 | Tragic 30.3% |
| Immigrants | Grenada | 3.4 /100 | #235 | Tragic 30.3% |
| Welsh | 3.2 /100 | #236 | Tragic 30.4% |
| Immigrants | St. Vincent and the Grenadines | 3.1 /100 | #237 | Tragic 30.4% |
| Slovaks | 2.8 /100 | #238 | Tragic 30.4% |
| Immigrants | Portugal | 2.1 /100 | #239 | Tragic 30.5% |